|
David's update Scientists at NASA and artists from StudioKCA wanted people to experience the movement of satellites through space. The NASA Orbit Pavilion was the result of that collaboration. In this exhibit, the trajectory of 20 earth-orbiting satellites, including the International Space Station where represented by a series of amplified surround speakers. The arrangement of these speakers lead to a spiralling symphony of satellites, each with their own distinct sound, Spiralling sounds were mirrored in the spiral of the pavilion. This symmetry between the sound and the shape of the pavilion helps to immerse both the visual and aural senses. I thought that this was a wonderful way to sonify data moving in space. This brings me back to my thoughts on sound in 3D space and the movement of sound. As the satellites circle the room, you can hear musical elements fall in or out as certain satellites move faster or slower. If you listen closely, you can hear the pairing of orbital chords when “satellites” converge on each other. The sounds of the satellites, and the satellites themselves, form regular patterns that are repeated. Repeated patterns occur all around us; from orbiting celestial bodies to stream networks to spectral reflectance (see previous post). Many of these patterns can be represented by mathematical principles. However, with every pattern, with every symmetry, there is also asymmetry and anisotropy. Music also mirrors these principles. There is an excellent video by the Santa Fe Institute that discusses this very point; the marriage between music and math. Many classical composers used patterns and symmetry in their music, like Bach. But on the other hand, there were avant gardes like Ornette Coleman, that destroyed any sense of patterns. These ideas of both the identifiable and the abstract interest me. With all these recent thoughts on musical patterns, sound geolocation (see previous post) and chats with Christina about transferring musical patterns into movement, I think I have some new ideas for updates to the Eco Orchestra code. Christina's update
Over the past few weeks, I’ve been thinking about legacy and lineage in both art and science. I’ve had the privilege to witness two modern dance pioneers in Philadelphia this month - groundbreaking postmodern choreographer Yvonne Rainer spoke in Philadelphia a few weeks ago, and the Martha Graham Dance Company (the performing company of arguably the founder of modern dance) came through on their tour this past weekend. Both had indelible impacts on the field of modern dance. Martha Graham developed a modern dance technique and showed the world a kind of performance that had never been seen before. Legendary choreographers Merce Cunningham and Paul Taylor got their start dancing with Graham and went on to radically advanced the dance world forward in their own ways. Both of them have also begat contemporary giants of the field, such as neoclassical giant David Parsons. Yvonne Rainer built on Graham’s legacy by rebelling against it - breaking open the form and structure of dance. Today, choreographers often trace their lineage to describe and position their work. This idea seems important in science as well as art. I often hear scientists talking about the concept of “standing on the shoulders of giants” - the idea that you’re only where you are because of what others did before you. For both artists and scientists, there is deep importance of knowing where you come from in order to develop something new. We are always building on the knowledge and discovery of those who came before. Seeing both of these great dance masters in the past few weeks has helped me clarify a number of things about my own choreography - thinking about ways to apply some of these ideas and principles, and establishing and acknowledging the roots of this project that I’m working on now. For example, Merce Cunningham usually developed his choreography in complete isolation of the music - a recent reflection I heard about his work noted that often, the only thing his choreography and the music had in common was their duration. He often used chance in order to determine the sequence of his movements, including utilizing the I Ching. This resonated with me as I consider how to approach data-driven music - the music isn’t random, but as I’ve written in previous blog posts, there are aspects of it that are particularly complex to enter into choreographically, since they are not planned out by the human compositional hand. So I’m chewing on ways that I can utilize chance to develop the movement for the piece that David and I are hoping to develop together. It is important to me that the choreography that I develop has a relationship to the music that is more than simply duration - I want it to be an interpretation of the music of the land after all – but nevertheless I think there is a lot I can take from the work of chance in dance by modern dance masters like Cunningham. Perhaps instead of developing a sequence comprehensively, I could say that a certain gesture equals a certain data range in the music, allowing the data to drive the structure of the movement. Standing on the shoulders of giants, in my case, has opened up new ways of thinking about how I approach this contemporary sciart work.
0 Comments
David's update Today I went on a wonderful hike in Shenandoah National Park. I have been coming to this park since 2010. The park straddles a section of the Appalachian Mountains and the Appalachian Trail. This is one of the best times of the year to go. The leaves are in the middle of changing colors in preparation for winter. 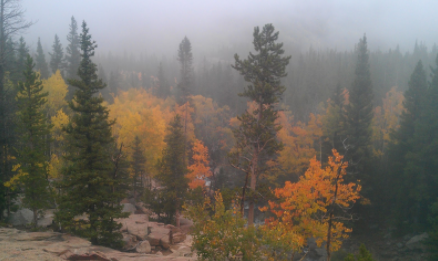 Fall in Rocky Mountain National Park (I didn’t have a good fall picture from Shenandoah) The timing of leaf-on and leaf-off conditions can have an effect on larger circulation of water vapor and CO2 in our atmosphere. With satellite remote sensing we can detect these conditions change in near-real time around the globe. There is an important parameter, Normalized Difference Vegetation Index (NDVI), we use that helps us distinguish between green vegetation and other landscapes. 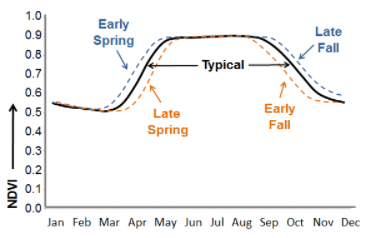 The seasonal change in NDVI, which is an important remote sensing parameter based on red and near-infrared light, represents the loss of chlorophyll and the eventual loss of the leaves. If we visualize this in chart form, the value of NDVI goes up as leaves begin growing on leaves in the spring, then the values go down when trees lose their leaves in the fall. While walking through the forest, you get to hear the birds singing, the trees swaying in the wind, deer prancing, and the sound of cars driving down Skyline Drive. With all these different sounds, we can generally pinpoint where it comes from. Christina and I discussed this idea early during the project. She had a similar feeling at the Woodlands, in Philadelphia. I figured I would revisit this idea with new perspectives; sound waves, geolocation or triangulation, and dampening. Like the energy from the sun, sound travels in waves. However, sound sources come from much smaller object and the waves travel much slower (768 mph). Sound propagates radially from its source. Therefore, if you had a network of receivers, like microphones or ears, you could locate the spatial location where the sound came from. This would be similar to how we measure earthquake locations and epicenters like the recent earthquakes in Italy. 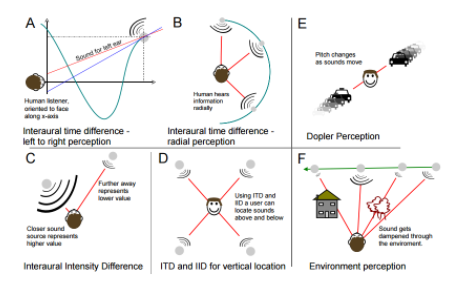 These figures show several ways that sound is perceived from different directions and in different conditions. (From: Nasir and Robert, 2007). Sound can also reflect (echo) off objects adding another layer of complexity in locating the source. Thinking about the way that sound travels in space may help in the spatialization of data to music. This could not only occur in the translation into music, but also in the way the sound is projected. I have some homework this week. Christina's update Since David and I first started this residency, I’ve been interested in the many layers of translation and mapping that are at play in our work. We make observations about the physical world in data of various forms, which is translated into a map, which David translates into music, which I’m working on translating into dance, which translates itself into a dance drawing (example below). Each layer of the process adds a new layer of meaning, and offers a different way to see and understand the same information - it’s simultaneously a classically scientific and artistic methodology of documenting and interpreting observations. 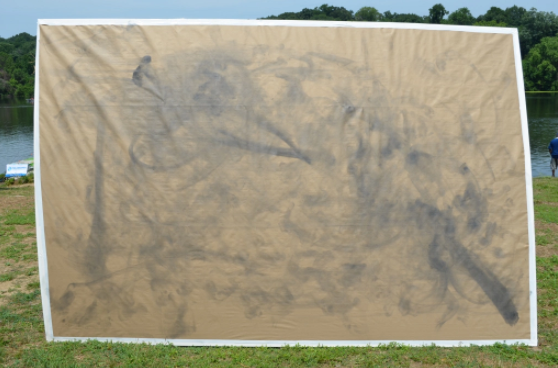 Christina Catanese, Traces: Schuylkill River I, Charcoal on paper, created in the process of two dancers performing a dance piece of the same name Perhaps this intrigues me because I’ve always loved maps and been fascinated by them. But the more I learn from David about remote sensing, the more I realize I don’t know. It’s amazing the things we can learn and convey through this fascinating process, and it is provoking my curiosity in a very intense way. It’s making me think even more deeply about how information about the environment can be reframed and projected differently across different mediums.
Just last night, I was continuing to read the John Luther Adams book I mentioned in my post last week - his journal entries indicate that he was thinking about the same process (an exciting bit of synchronicity to me). Describing his process of generating sounds from geophysical data, he writes, “We’re taking streams of numbers that represent geophysical phenomena and using them to create maps of another kind. From these musical maps we’re generating sounds - derived from the original phenomena, but very different in sensation...The terrain becomes a map that yields a new map that reveals a new terrain.” [emphasis mine] And so, I think it’s even more intriguing because these maps and translations, in their various forms and configurations, all evoke something about the land or the phenomenon, but are not themselves that thing. Maps, music, dance, drawing - all are a frame or lens that, all in their own way, help us to understand what’s happening in the world, but in the end they will never be perfect representations. And perhaps that’s how it should be. As Adams wrote, they reveal new terrain, show us something about the essence of what’s happening, and generate new insights and information. The question of accuracy is one I give a lot of thought to in the sciart realm - and while I firmly believe we should be getting the science right, not all science-based art will or should be direct, didactic, or representational. It will always be its own map, its own terrain, its own reflection, and its own gateway to deeper understanding. 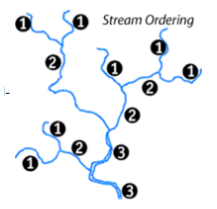 Fig. Generalized stream order classification Fig. Generalized stream order classification David's update Path of Least Resistance Water flows downhill. The path the water takes is affected by the geology, but most importantly, gravity. As more and more water accumulates, the larger the channel, tributary, or stream becomes. The smallest streams are called first-order streams. When lower-order streams connect, the order number goes up (Fig. 1). When a stream reaches seven orders, it is then considered a river. The Amazon River is a 12th-order stream. I bring up the concept of elevation. streams, and rivers because I have been thinking a lot about the translation of spatial data into music. Christina first brought up this idea in one of our early conversations. For her choreography, she likes to understand different aspects of the the music; knowing the starts and stops; identifying details within the music. This is her mapping of the music. One important question she had was, “how is the music translated?”. In other words, where is the music coming from on the map (gridded space). My answer was relatively simple, “from a line drawn across a grid”. These lines were primarily arbitrary, but I did chose where to draw the line. The data pixels that were overlain by the line are then read in order; one pixel = one note. However, with some recent datasets I have been working with and speaking to Christina, I plan to let the land, or the digital replica of the land, determine the direction which the music is translated. In my research, I am looking at the relationship between watersheds and change along the coastal areas. In the image below (Fig. 2), you can see the major rivers in the US. The information in this image was derived from data collected by the Shuttle Radar Topography Mission in 2000. This satellite sensor was deployed from the Space Shuttle Endeavor during an 11-day mission to measure the elevation of the earth at a 30meter x 30meter grid. The elevation data can then be converted to a flow direction, which is based on the relative height between each pixel. The direction data then help to determine the accumulation of “pixels” that “drain” into adjacent pixels. And this brings me back to the streams and rivers. I like the idea of letting the streams and rivers set the direction of the music. The pitch and rhythm would still come from the spectral data, like I mentioned in the previous post, the order of the notes will just be determined by elevation data. 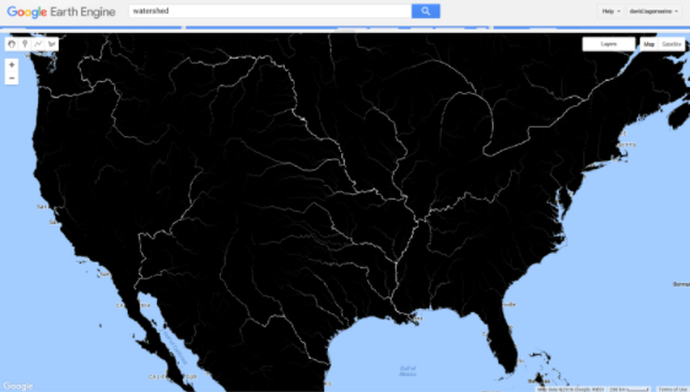 Fig. 2 Major rivers in the US. This image was derived from radar satellite data and displayed in Google Earth Engine. Sometimes you have those moments that you think your computer, or Facebook, or google are listening to you. I had that moment this week. All these ideas about rivers and the “flow” of music, the same dataset that I was using, showed up on a Facebook post. In particular, it was an artist and GIS expert (Geographic Information System) that used an elevation map to highlight the different river basins within the US. Each color in Fejetlenfej’s map is a different river basin. The Mississippi Basin is easily distinguishable in the pink in the center of the US. 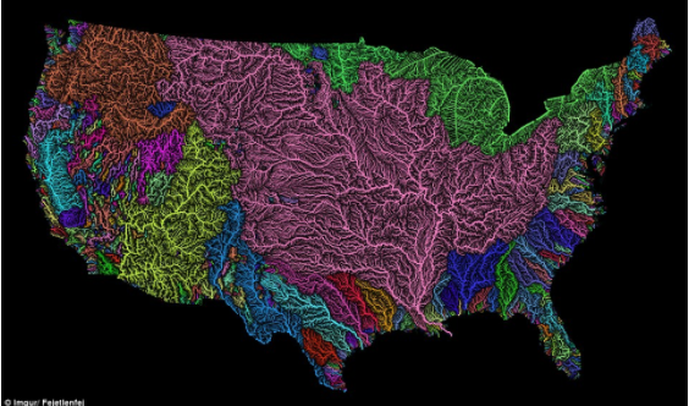 http://www.dailymail.co.uk/sciencetech/article-3860062/The-veins-America-Stunning-map-shows-river-basin-US.html Christina's update This week, I’ve been continuing to chew on ideas around music, sound, data, and natural systems. This summer, I was lucky to spend three weeks in south-central Alaska, and got to see John Luther Adams’ permanent light and sound installation, The Place Where You Go To Listen, at the Museum of the North. Adams is one of my most favorite composers, so this was somewhat of an artistic pilgrimage for me. This work interprets real-time geophysical data into sound and light. Depending on the time of day, weather conditions, and time of year, the colors shift and the harmonies expand and narrow in response to the amount of daylight. If there is seismic activity, even if unnoticeable by humans, the bass drums rumble. Bell-like sounds ring high in the room if the aurora borealis is active. Even the moon rises and falls, in sound. The room is always changing, in response to what is happening in the world outdoors. I spent a lot of time in The Place, listening. Though it wasn’t the most dynamic day - it was a brilliant sunny day, too early in the year for the aurora, and there were no earthquakes, even small ones - it was an amazing opportunity to reflect on what is uncovered and revealed by turning these data streams into all-encompassing place-based music and enveloping light. 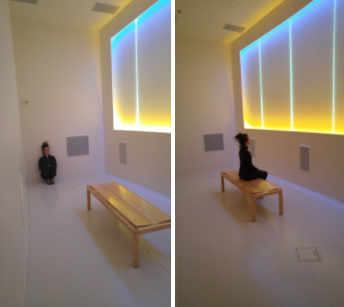 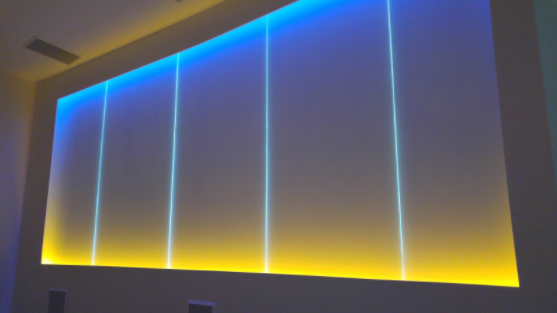 Besides the brain food, my souvenir was a book Adams wrote documenting and reflecting on the process of creating the place, which I’ve been reading and has been a wonderful companion in this very process-based residency. It has given me a lot of thinking fodder about the how and the why of turning data into music, and how dance/movement can add another layer of interpretation to it. The first chapter of this book is available as an essay here, and worth a read.
Adams writes, “As a composer it is my belief that music can contribute to the awakening of our ecological understanding,” taking ecology to be a study of patterns and connections that he makes manifest through music. Adams searches for an ecology of music, and I think, for David and I, a cartography of music is a related pursuit. Another passage of Adams’ I found interesting in our context: “If music grounded in tone is a means of sending messages to the world, then music grounded in noise is a means of receiving messages from the world...Rather than a vehicle for self-expression, music becomes a mode of awareness.” This really resonated with me as far as data that is generated from data, which, though it has important points of human input, it is less an expression of the composer themselves and more an expression of concepts. In a way, it is a more humbling way to work as an artist, in service of something greater than your own creative ego or agenda. Adams wraps up this essay with some reflections on art and science, and what he sees as their similarities, differences, and ways they come together. “Art and science also embody two minds, two ways of understanding the world in which we live. Yet these two minds share a more fundamental unity than we sometimes recognize. And they have much to say to one another, especially in our times.” Art and science certainly do, and so do David and I! David's update Music from Remote [Sensing] Places Satellite images, like those collected from NASA’s Landsat satellite, record the sun’s electromagnetic energy that are reflected off the earth’s surface (Fig. 1). In the figure below, energy from the sun travels through space until it eventually encounters our atmosphere and the surface of the earth. That energy is then absorbed or reflected. The amount of energy absorbed or reflected depends on the properties of the object. 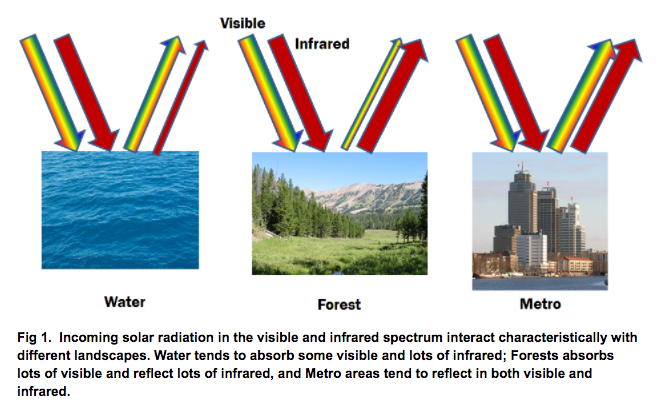 Our eyes work similarly to the satellite sensors, however, our eyes are limited to only a very small fraction of the EM spectrum. In fact, our eyes can only perceive EM waves between blue and red light. Sensors onboard the Landsat satellite, measure the visible light, but also can detect changes in the near-infrared (NIR) and short-wave infrared (SWIR) (Fig.1). The amount of energy reflected in the infrared, the light we can’t see, can tell us a lot about the different objects on the surface of the earth. In particular, we can easily identify vegetated and non-vegetated areas. Landsat records information about the reflected energy in seven strategic locations within the EM spectra; blue, green, red, NIR, SWIR1, SWIR2, and thermal (much longer waves). In other words, one image provides us with a wealth of information about the properties of the earth’s surface. Visually, we can represent the different layers of data in a Red-Green-Blue (RGB) composite image. If we use the red-layer for Red, the green layer for Green, and the blue layer for Blue, this is a true-color image. This would be like how we would see the earth from the perspective of the satellite. Any other combination of layers for the RGB, we refer to as a false-color composite. These false-color composites can really help to make particular features stand out. Watch this NASA video to help you get a better idea on how the different layers can be perceived. EcoOrchestra translates this satellite imagery into music in a process called data sonification. In other words, it translates digital information into sounds or music. Data sonification has traditionally been translated in a temporal fashion. This means that data collected in one spot over time is converted to sound. There are many nice examples of this; telling the story of climate change, listening to the data collected in the river over a day, listening to the growth of trees. EcoOrchestra works more in 2- or 3-dimensions. This is because the image is essentially a map. Therefore, we can provide a 2D space in the North-South direction and the East-West direction. The data itself would be the third dimension. Each layer of the image can then be represented by a different instrument, and the numbers from the data can be converted to pitch where larger numbers represent higher pitches and lower numbers represent lower pitches. The rhythm is then controlled by the frequency, or how many times the data values show up. The algorithm, or computer code, that translates the satellite data is highly customizable, so we are able to change the instruments, the rhythm, and the way the data is read, resulting in a unique musical experience with the click of the mouse for anywhere in the world. Listen to the rest of EcoOrchestra here: https://soundcloud.com/eco-ochestra Christina's update I tend to be very musically driven in my choreography, and feel strongly motivated by music to create movement. Music isn’t usually the very first artistic choice I make, but sometimes it is. Sometimes I’ll hear a song and know almost immediately that I can make a dance to it; it’s somewhat rarer for me to have an idea and then look for the music to serve as the backdrop for it - though it does happen. Even when I’m listening to music casually, I tend to glean more enjoyment from music I could see myself choreographing to. When I’m creating a dance piece, once I’ve decided on a concept and a piece of music, I play the music over and over and over again at every opportunity - in the car, at home, at my desk. I feel I need to inhabit the music if I am to respond to it authentically. I familiarize myself with every nuance, turn it over in my mind and look at it from different angles, and consider the possibilities. At this point, I’ll often start imagining movement as well - short phrases may start to coalesce, and I might even start having some sense of overarching trajectory of the piece. I choreograph mentally, sometimes for quite a while - sometimes I call these musings “car-eography,” if I’m mulling on them while driving. I do this until I can’t take it anymore and have to start putting things down to paper and capturing my ideas more formally.
I think it’s really interesting that for years, I have somewhat subconsciously been using terms rooted in physical geography to describe my choreographic practice (music mapping, inhabiting the music, road map for the piece, etc), and now I’m working on a project through SciArt Bridge where the music literally comes from mapping.
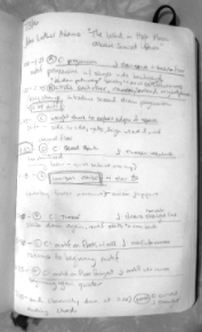
Starting, as I do, in the initial phase of my music familizaring, I’ve been listening to David’s EcoOrchestra pieces to get acquainted with them. I’m struck by how much they feel like a very particular kind of modern music, even though they weren’t composed by a human, per se, to have anything like what we conceive of as musical form and structure. Some of the EcoOrchestra pieces call to mind for me early modern dance works like those of Martha Graham, created to music that was very atonal and percussive in its instrumentation, hard to latch onto or know where you are in it. Purely from an acoustic perspective, this is very different than the kind of music I typically reach for for my choreography, so it will be interesting for me to figure out how to respond to it with movement. So far, I’ve just been listening to the Ecoorchestra songs David sent me in my car while driving, but I can feel that I’m getting close to needing to map the music. This is earlier in my process than I would typically go to this step, but it feels important because I haven’t quite found my way in the pieces yet. Though I know they are translating data into imagery, I don’t feel like I quite know what the notes mean and what data they correspond to - is the fast, percussive section a human landscape or a natural one? Is this new, high pitched portion signalling land use change? I’m excited to have David walk me through some of the pieces in more depth, so I can understand not just the music itself, but the landscape it is sonifying. Part of what I am most interested in is how EcoOrchestra translates remote sensing data into music, and how and if this translation from tables to acoustic signals can somehow help us to feel the data and understand it more intuitively. In thinking about responding choreographically to these pieces, I also want my dance to serve this goal. But to make a mapping-based dance, first I have to get to my own mapping. By David & Christina Hello world - here we are, reporting for our first blog post as part of our SciArt collaborative process. We feel like we're just starting to get into it, at the very beginning of our wade into the pool of collaborative possibilities. Even though it's early on, we've had a lot to talk about, being two hydrogeology-oriented folks who are interested in interpreting earth science data in nontraditional ways. I've [Christina] always loved maps, so have been really fascinated to hear about David's work in remote sensing, and the program he helped created to turn satellite images into music (EcoOrchestra). I've also been experiencing the phenomenon of once you start paying attention or working on a certain idea, you start seeing that thing or connections to it everywhere - suddenly, sound and data and maps seem to be popping up everywhere for me! I [David] created a Google Doc for us to start to organize our ideas and reflections. This way when we feel inspired we can easily share our thoughts on science, dance, and music. We also share videos and links to connect our ideas across disciplines. We've gotten into some interesting conversations so far about the three-dimensionality of music, how data become music, and more. Christina introduced me to new iconic figures in dance, and new ideas on music and the conversion of data to music. I believe Christina's thoughts on dance, movement, and the flow of water will be help connect the 2-D map perspective in a 3-D space. Please enjoy a screenshot of the current state of our Google Drive, and experience the true unedited reflections on geoscience, data, music, sound, and dance! 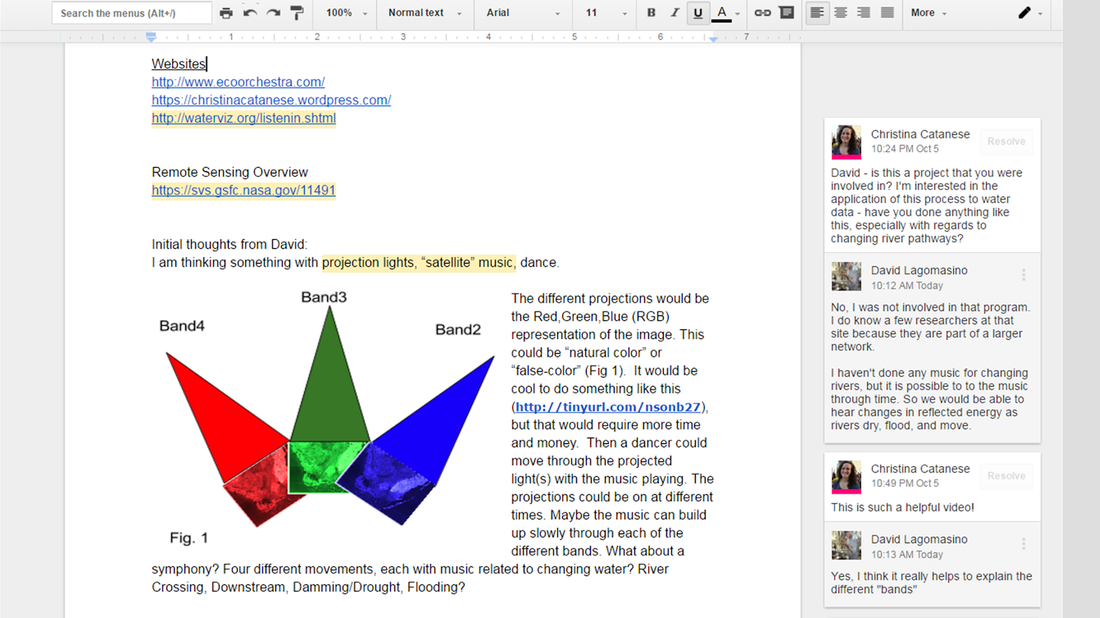  
|
Visit our other residency group's blogs HERE
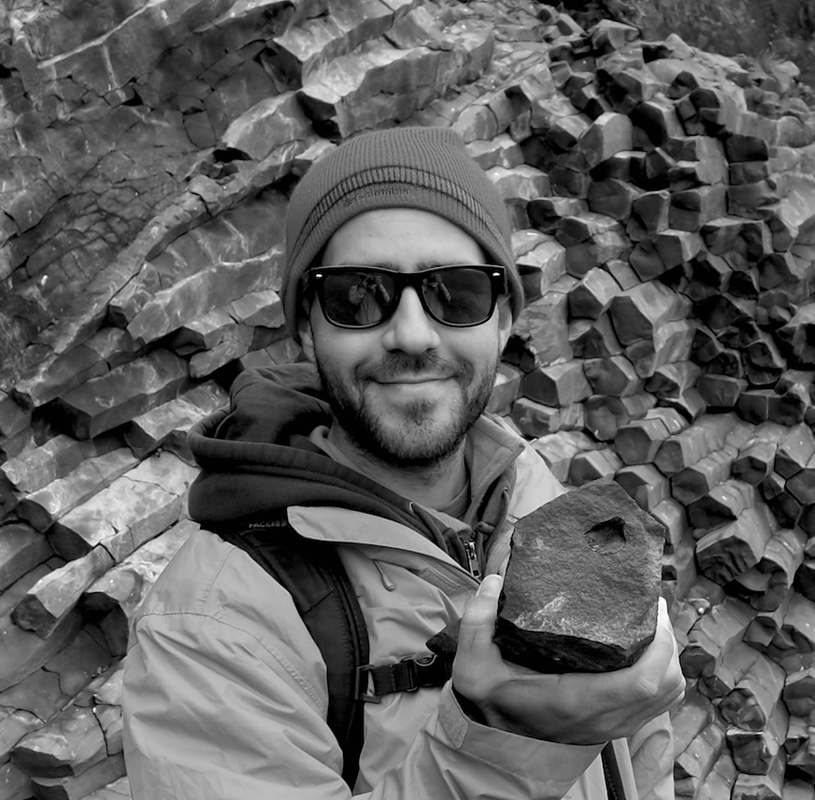
David Lagomasino is an award-winning research scientist in Biospheric Sciences at the NASA Goddard Space Flight Center in Maryland, and co-founder of EcoOrchestra.
Christina Catanese is a New Jersey-based environmental scientist, modern dancer, and director of Environmental Art at Schuylkill Center for Environmental Education.
|