|
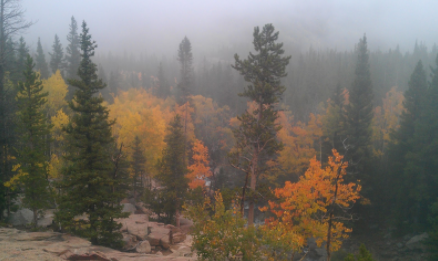
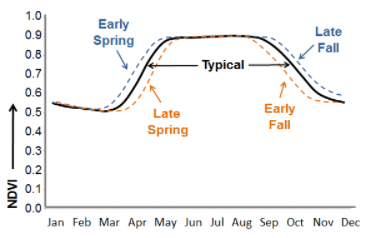
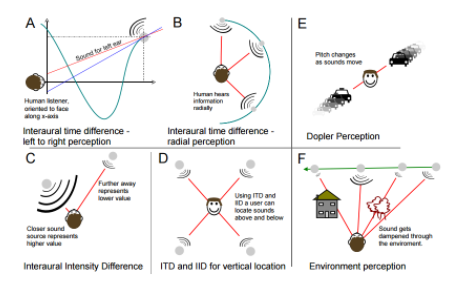
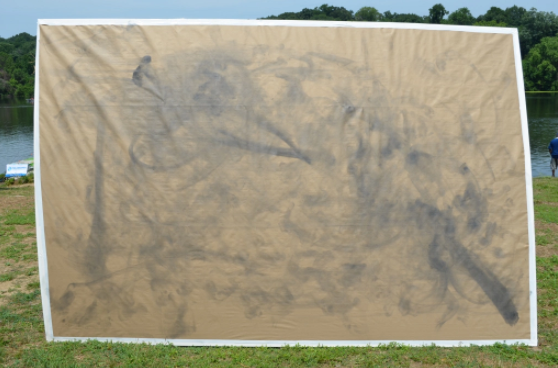
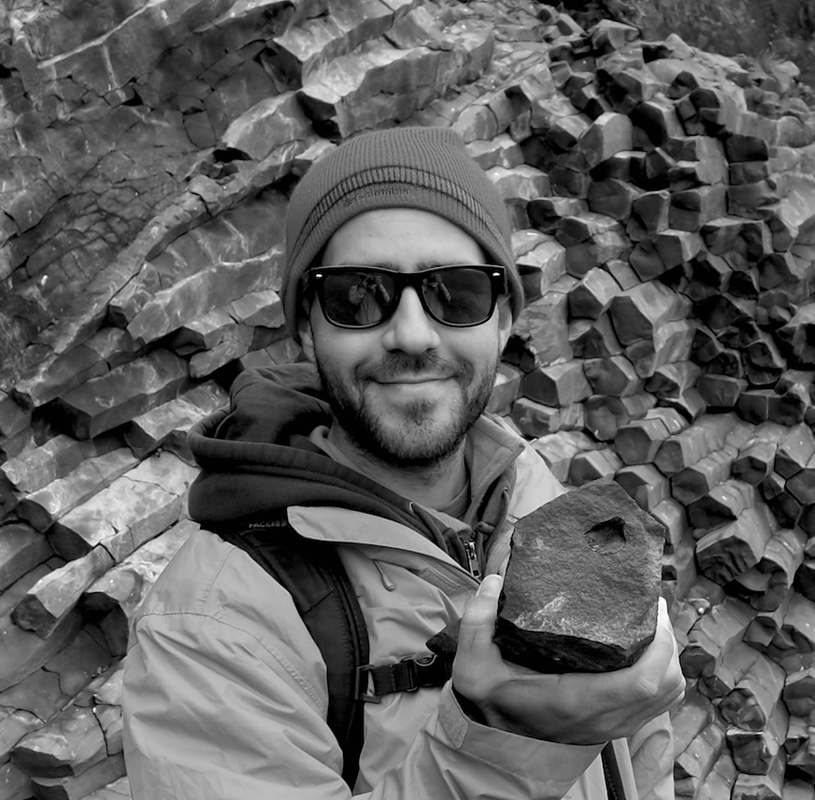
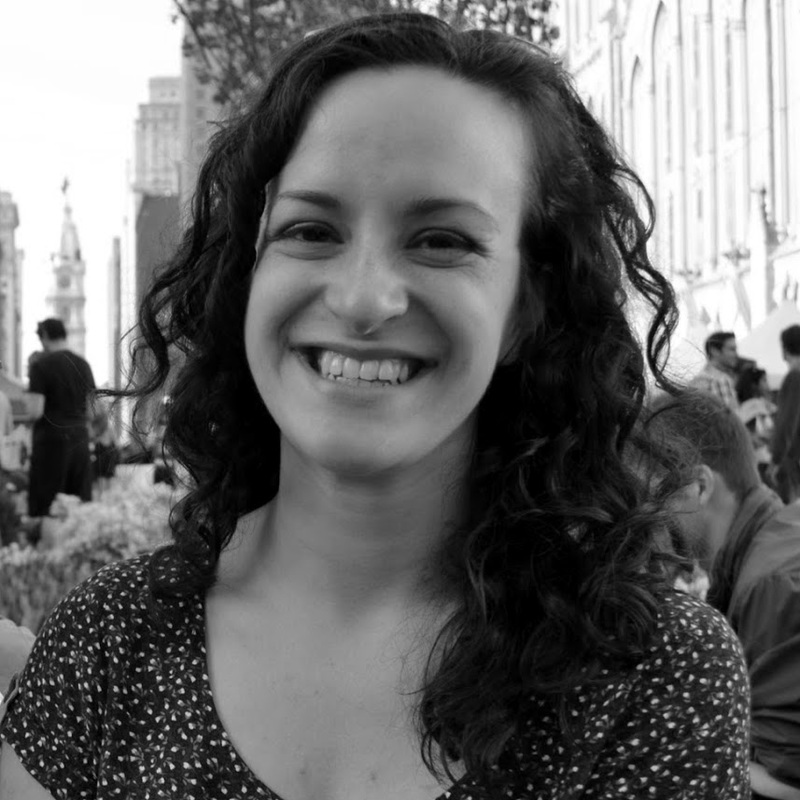
David's update Today I went on a wonderful hike in Shenandoah National Park. I have been coming to this park since 2010. The park straddles a section of the Appalachian Mountains and the Appalachian Trail. This is one of the best times of the year to go. The leaves are in the middle of changing colors in preparation for winter. The timing of leaf-on and leaf-off conditions can have an effect on larger circulation of water vapor and CO2 in our atmosphere. With satellite remote sensing we can detect these conditions change in near-real time around the globe. There is an important parameter, Normalized Difference Vegetation Index (NDVI), we use that helps us distinguish between green vegetation and other landscapes. The seasonal change in NDVI, which is an important remote sensing parameter based on red and near-infrared light, represents the loss of chlorophyll and the eventual loss of the leaves. If we visualize this in chart form, the value of NDVI goes up as leaves begin growing on leaves in the spring, then the values go down when trees lose their leaves in the fall. While walking through the forest, you get to hear the birds singing, the trees swaying in the wind, deer prancing, and the sound of cars driving down Skyline Drive. With all these different sounds, we can generally pinpoint where it comes from. Christina and I discussed this idea early during the project. She had a similar feeling at the Woodlands, in Philadelphia. I figured I would revisit this idea with new perspectives; sound waves, geolocation or triangulation, and dampening. Like the energy from the sun, sound travels in waves. However, sound sources come from much smaller object and the waves travel much slower (768 mph). Sound propagates radially from its source. Therefore, if you had a network of receivers, like microphones or ears, you could locate the spatial location where the sound came from. This would be similar to how we measure earthquake locations and epicenters like the recent earthquakes in Italy. These figures show several ways that sound is perceived from different directions and in different conditions. (From: Nasir and Robert, 2007). Sound can also reflect (echo) off objects adding another layer of complexity in locating the source. Thinking about the way that sound travels in space may help in the spatialization of data to music. This could not only occur in the translation into music, but also in the way the sound is projected. I have some homework this week. Christina's update Since David and I first started this residency, I’ve been interested in the many layers of translation and mapping that are at play in our work. We make observations about the physical world in data of various forms, which is translated into a map, which David translates into music, which I’m working on translating into dance, which translates itself into a dance drawing (example below). Each layer of the process adds a new layer of meaning, and offers a different way to see and understand the same information - it’s simultaneously a classically scientific and artistic methodology of documenting and interpreting observations. Christina Catanese, Traces: Schuylkill River I, Charcoal on paper, created in the process of two dancers performing a dance piece of the same name Perhaps this intrigues me because I’ve always loved maps and been fascinated by them. But the more I learn from David about remote sensing, the more I realize I don’t know. It’s amazing the things we can learn and convey through this fascinating process, and it is provoking my curiosity in a very intense way. It’s making me think even more deeply about how information about the environment can be reframed and projected differently across different mediums.
Just last night, I was continuing to read the John Luther Adams book I mentioned in my post last week - his journal entries indicate that he was thinking about the same process (an exciting bit of synchronicity to me). Describing his process of generating sounds from geophysical data, he writes, “We’re taking streams of numbers that represent geophysical phenomena and using them to create maps of another kind. From these musical maps we’re generating sounds - derived from the original phenomena, but very different in sensation...The terrain becomes a map that yields a new map that reveals a new terrain.” [emphasis mine] And so, I think it’s even more intriguing because these maps and translations, in their various forms and configurations, all evoke something about the land or the phenomenon, but are not themselves that thing. Maps, music, dance, drawing - all are a frame or lens that, all in their own way, help us to understand what’s happening in the world, but in the end they will never be perfect representations. And perhaps that’s how it should be. As Adams wrote, they reveal new terrain, show us something about the essence of what’s happening, and generate new insights and information. The question of accuracy is one I give a lot of thought to in the sciart realm - and while I firmly believe we should be getting the science right, not all science-based art will or should be direct, didactic, or representational. It will always be its own map, its own terrain, its own reflection, and its own gateway to deeper understanding.
1 Comment
|
Visit our other residency group's blogs HERE
David Lagomasino is an award-winning research scientist in Biospheric Sciences at the NASA Goddard Space Flight Center in Maryland, and co-founder of EcoOrchestra.
Christina Catanese is a New Jersey-based environmental scientist, modern dancer, and director of Environmental Art at Schuylkill Center for Environmental Education.
|

