|
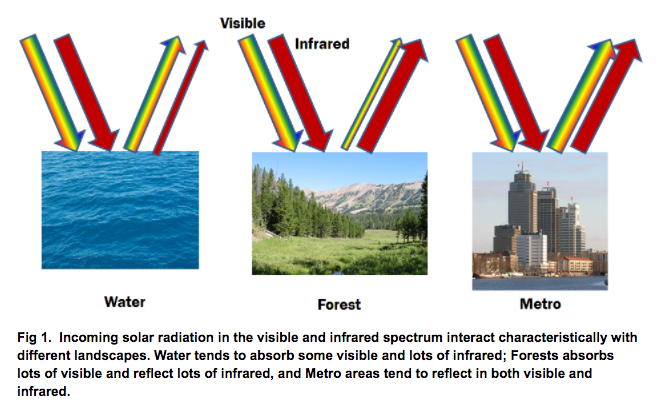
David's update Music from Remote [Sensing] Places Satellite images, like those collected from NASA’s Landsat satellite, record the sun’s electromagnetic energy that are reflected off the earth’s surface (Fig. 1). In the figure below, energy from the sun travels through space until it eventually encounters our atmosphere and the surface of the earth. That energy is then absorbed or reflected. The amount of energy absorbed or reflected depends on the properties of the object. Our eyes work similarly to the satellite sensors, however, our eyes are limited to only a very small fraction of the EM spectrum. In fact, our eyes can only perceive EM waves between blue and red light. Sensors onboard the Landsat satellite, measure the visible light, but also can detect changes in the near-infrared (NIR) and short-wave infrared (SWIR) (Fig.1). The amount of energy reflected in the infrared, the light we can’t see, can tell us a lot about the different objects on the surface of the earth. In particular, we can easily identify vegetated and non-vegetated areas. Landsat records information about the reflected energy in seven strategic locations within the EM spectra; blue, green, red, NIR, SWIR1, SWIR2, and thermal (much longer waves). In other words, one image provides us with a wealth of information about the properties of the earth’s surface. Visually, we can represent the different layers of data in a Red-Green-Blue (RGB) composite image. If we use the red-layer for Red, the green layer for Green, and the blue layer for Blue, this is a true-color image. This would be like how we would see the earth from the perspective of the satellite. Any other combination of layers for the RGB, we refer to as a false-color composite. These false-color composites can really help to make particular features stand out. Watch this NASA video to help you get a better idea on how the different layers can be perceived. EcoOrchestra translates this satellite imagery into music in a process called data sonification. In other words, it translates digital information into sounds or music. Data sonification has traditionally been translated in a temporal fashion. This means that data collected in one spot over time is converted to sound. There are many nice examples of this; telling the story of climate change, listening to the data collected in the river over a day, listening to the growth of trees. EcoOrchestra works more in 2- or 3-dimensions. This is because the image is essentially a map. Therefore, we can provide a 2D space in the North-South direction and the East-West direction. The data itself would be the third dimension. Each layer of the image can then be represented by a different instrument, and the numbers from the data can be converted to pitch where larger numbers represent higher pitches and lower numbers represent lower pitches. The rhythm is then controlled by the frequency, or how many times the data values show up. The algorithm, or computer code, that translates the satellite data is highly customizable, so we are able to change the instruments, the rhythm, and the way the data is read, resulting in a unique musical experience with the click of the mouse for anywhere in the world. Listen to the rest of EcoOrchestra here: https://soundcloud.com/eco-ochestra Christina's update I tend to be very musically driven in my choreography, and feel strongly motivated by music to create movement. Music isn’t usually the very first artistic choice I make, but sometimes it is. Sometimes I’ll hear a song and know almost immediately that I can make a dance to it; it’s somewhat rarer for me to have an idea and then look for the music to serve as the backdrop for it - though it does happen. Even when I’m listening to music casually, I tend to glean more enjoyment from music I could see myself choreographing to. When I’m creating a dance piece, once I’ve decided on a concept and a piece of music, I play the music over and over and over again at every opportunity - in the car, at home, at my desk. I feel I need to inhabit the music if I am to respond to it authentically. I familiarize myself with every nuance, turn it over in my mind and look at it from different angles, and consider the possibilities. At this point, I’ll often start imagining movement as well - short phrases may start to coalesce, and I might even start having some sense of overarching trajectory of the piece. I choreograph mentally, sometimes for quite a while - sometimes I call these musings “car-eography,” if I’m mulling on them while driving. I do this until I can’t take it anymore and have to start putting things down to paper and capturing my ideas more formally.
I think it’s really interesting that for years, I have somewhat subconsciously been using terms rooted in physical geography to describe my choreographic practice (music mapping, inhabiting the music, road map for the piece, etc), and now I’m working on a project through SciArt Bridge where the music literally comes from mapping.
Starting, as I do, in the initial phase of my music familizaring, I’ve been listening to David’s EcoOrchestra pieces to get acquainted with them. I’m struck by how much they feel like a very particular kind of modern music, even though they weren’t composed by a human, per se, to have anything like what we conceive of as musical form and structure. Some of the EcoOrchestra pieces call to mind for me early modern dance works like those of Martha Graham, created to music that was very atonal and percussive in its instrumentation, hard to latch onto or know where you are in it. Purely from an acoustic perspective, this is very different than the kind of music I typically reach for for my choreography, so it will be interesting for me to figure out how to respond to it with movement. So far, I’ve just been listening to the Ecoorchestra songs David sent me in my car while driving, but I can feel that I’m getting close to needing to map the music. This is earlier in my process than I would typically go to this step, but it feels important because I haven’t quite found my way in the pieces yet. Though I know they are translating data into imagery, I don’t feel like I quite know what the notes mean and what data they correspond to - is the fast, percussive section a human landscape or a natural one? Is this new, high pitched portion signalling land use change? I’m excited to have David walk me through some of the pieces in more depth, so I can understand not just the music itself, but the landscape it is sonifying. Part of what I am most interested in is how EcoOrchestra translates remote sensing data into music, and how and if this translation from tables to acoustic signals can somehow help us to feel the data and understand it more intuitively. In thinking about responding choreographically to these pieces, I also want my dance to serve this goal. But to make a mapping-based dance, first I have to get to my own mapping.
0 Comments
Leave a Reply. |
Visit our other residency group's blogs HERE
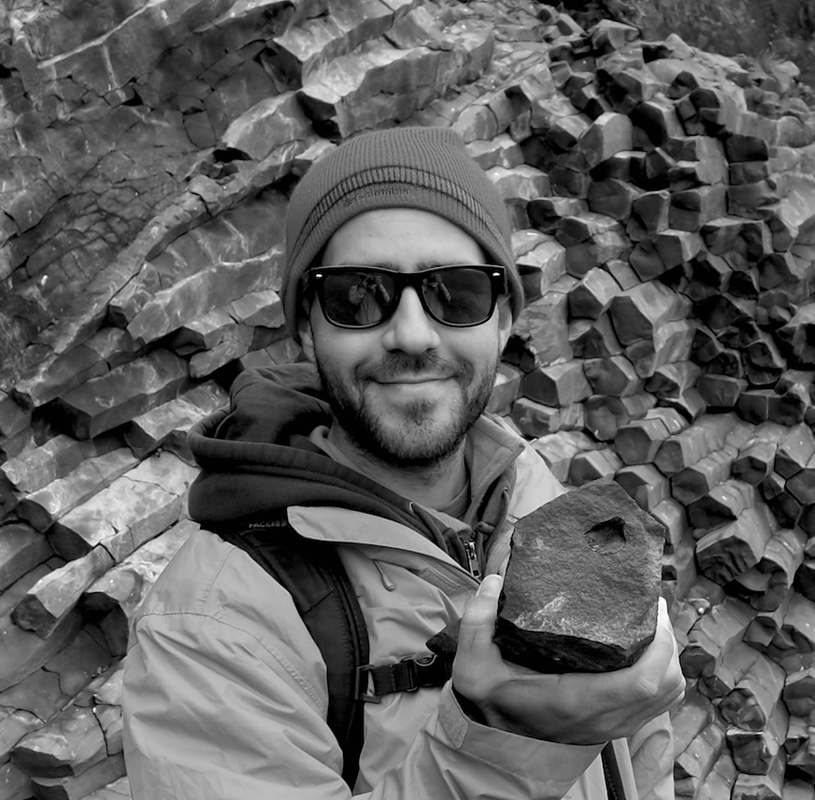
David Lagomasino is an award-winning research scientist in Biospheric Sciences at the NASA Goddard Space Flight Center in Maryland, and co-founder of EcoOrchestra.
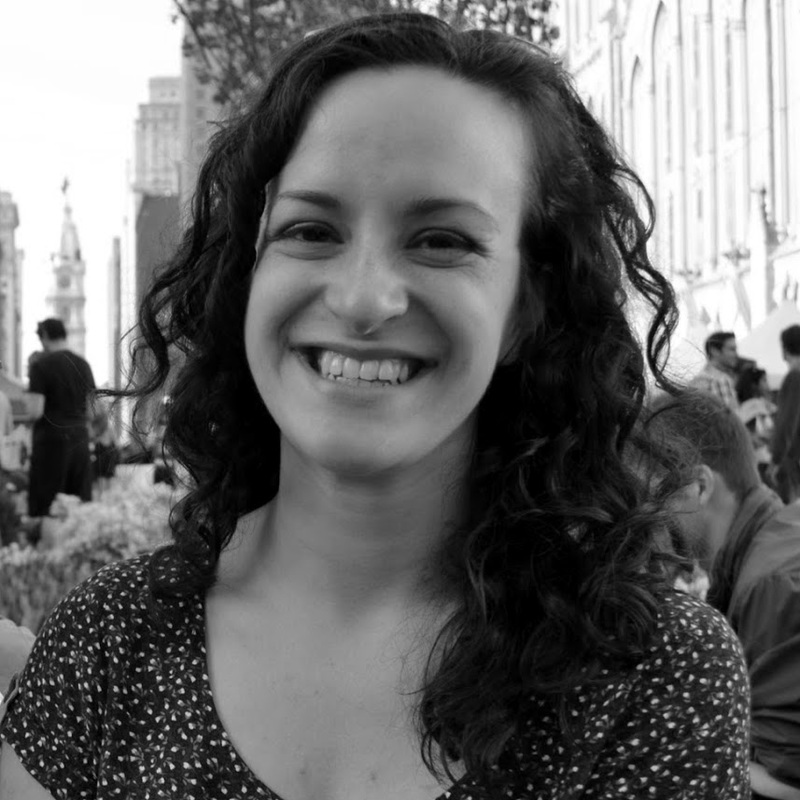
Christina Catanese is a New Jersey-based environmental scientist, modern dancer, and director of Environmental Art at Schuylkill Center for Environmental Education.
|


