|
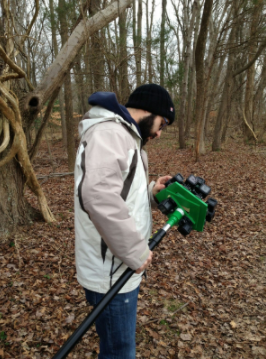
David's update Four months ago, when we started this residency, I did not know what to expect. Christina and I had similar scientific upbringings. Where we differed was in art. I do music, Christina does dance. We both have a passion for integrating our arts and science and pairing up with Christina has allowed us to look at our crafts, both science and art, in new ways. The residency has been a great experience that has allowed me to think differently about my science, how I communicate it science, and my interests in data sonification. We started off with some basic ideas. Maps, drawings, music, dance. Slowly, after a few conversations, we started to break apart the essence of each of our ideas. Maps and drawings represent a two-dimensional space. Music and dance are abstract versions of three dimensional space. Going into this project I have been trying to translate 2D information into 3D (maps to music), while Christina went from 3D to 2D (dance to drawings). After a few weeks we started to pull out this theme. For me, satellite imagery is a scientific tool to help with our understanding of the world around. The pictures, and the different layers within the pictures, can provide unique perspectives that can not be seen by the naked air. Similarly, music is an artistic tool that also helps us make sense of the world around. Music and insight happiness, insight fear, excitement… Putting these together we can tell a story, that has traditionally only been told through complicated charts and graphs. What Christina and I have been working on, and plan to continue collaborating on after the end of our residency, is to make some of this information more exciting by translating digital image information into music and movement. But on a deeper level we are trying to reconcile the transition between 2D and 3D. Our project is still under development, but many of the pieces have already been connected. We had some relatively high expectations that we both still want to pursue. At this point now, I have revised the data sonification code to include multiple satellite imagery datasets. This includes MODIS daytime spectral data, MODIS night lights, radar elevation data, as well as stream network models derived from elevation. This integration alone was time consuming as there was a lot of rewriting and troubleshooting that needed to be done. Because of this, I was not able to provide Christina with a finalized version of the music from the Susquehanna River. Though we have been able to produce a small sample of music translated from all of those different data sources. Future iterations of the music will need to be refined slightly before the final composition. In addition, the 360 camera is up and running. It has been tested with imagery, which has come out amazing and can be viewed in virtual reality. I am really looking forward to working with Christina to integrate the 360 camera with her dance movements. I believe the 360 camera will help add an immersive layer to our project. So not only do we keep our 2D-to-3D themes, but we can add to the Virtual Residency Program with Virtual Reality.
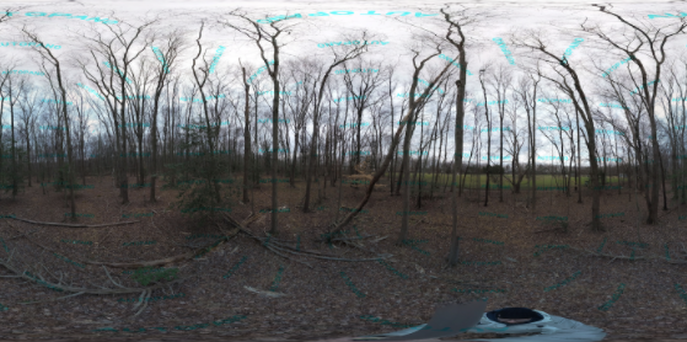 A 360 panorama stitched together from 14 photos pointed in all different directions. This image can then be viewed in 360 with virtual reality goggles.
0 Comments
Christina's update
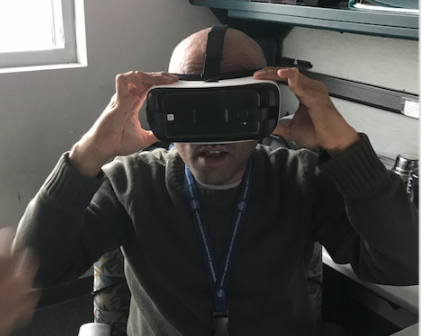
In addition to working on the music and movement that we’ve been writing about recently, David was telling me about 360 video, which is something he has been working on that could have interesting dimensions for our project, to potentially document the performance piece that we work towards. I’ve been spending some time familiarizing myself with this medium and thinking about the possibilities. I started with a tutorial that David shared with me which gives a lot of nuts and bolts information about how 360 videos are made. It gave me a good foundational understanding, but also made me glad to have David as a collaborator to do the nitty gritty technology and processing pieces! 360 videos are pretty cool in that you record in multiple directions at the same time, and the end result is a video that the viewer can drag and pan around to view different parts of the video for a more immersive experience (or, if watching on a mobile device or VR headset, just move the device / your gaze around). I then started looking into examples of 360 videos, which really run the gamut. I found videos that ranged from scientists climbing redwoods and showing the view around them as they went up, to car companies showing the inside of a new model, to realtor listings of houses on the market. I encountered a number of videos that were simply shots of natural places - forests with running streams, rustling leaves, and bird songs, nothing staged or modified or added besides post-processing, just like being in the woods...except not. These seem to have spurred some lively internet debates on whether or not 360 video is a good tool as far as getting people more connected with nature. On one hand, utilizing these technologies may help to engage more people in outdoor activity through a novel methodology and through technology, which is now so ubiquitous that we all rely on it daily. On the other hand, even the most realistic version of nature is not nature at all. I looked into some examples of how 360 video had been used in dance, and noted themes and differences across how the technology was utilized and what was successful. Some positioned the “audience” (the camera) at the center and staged everything around it, as if the center was downstage. This manner of staging resulted in a lot of direct interaction with the viewer regardless of where you panned the video, and a feeling like you were always seeing the piece from the front as well as feeling seen by the performer. https://www.youtube.com/watch?v=Avl50Izo1p8&t=199s - contemporary https://www.youtube.com/watch?v=VNHDV4iR_p4 - contemporary https://www.youtube.com/watch?v=GWpfQkQv_OY - hip hop dance battle Other videos placed the camera at the center of a traditional proscenium stage, which had the effect of feeling like you were on stage with the dancers. This gave an interesting feeling of being an invisible, up close viewer with the action of a performance going on around you. This intrigued me, but sometimes it felt like the choreography was not changed substantially for this new orientation, but an application of the technology to an unmodified piece. https://www.youtube.com/watch?v=vEk2poiXSFU - Dancing with the Stars opening https://virtualrealityreporter.com/the-first-ballet-experience-in-vr-360-video/ - ballet with “spatial music” violinist moving along with the dancers There were a number of behind the scenes videos that place the viewer in the studio. I enjoyed this dynamic view into the process behind creating the dance performance, an element which is often unseen. Some of them gave me a feeling of being inside a Degas painting which had been activated. https://www.youtube.com/watch?v=yo2keosacZY https://www.youtube.com/watch?v=MNi-nnEwc9g A few pieces (probably the ones that intrigued me the most) were site specific or relied heavily on the place in which they were situated for the effect of the video. This particular approach seems like the kind I would feel most likely to approach artistically. https://www.youtube.com/watch?v=dfSfbsNZl0A - contemporary dance in two different indoor spaces https://www.youtube.com/watch?v=39hE_uQlTrE - Sergei Polunin https://www.youtube.com/watch?v=BL-As0CMctE - site specific Which brings me back to the idea of whether technology like this can help develop deeper connections between people and nature. I think if a 360 video can activate a space to help people see and notice things about it that they might not have on their own, which is part of what I see as one of the most important roles of an artist. I’ve been chewing on a lot of ideas about staging a dance in a natural space could look like, so that the viewer could pan around the scene and discover dancers in various spaces to highlight different elements of the landscape. One difficulty I found about 360 videos is that I was always worried that I was missing something. In a traditional performance in a theater, what the audience sees is much more directed and controlled - you’ll only miss something if you close your eyes. But with a 360 video, if you’re panned to one area and something pops up behind you, you might miss it. This resulted, for me, in a kind of digital and artistic FOMO, but also intrigued me about how it might be possible to create a piece in which nothing was lost by not seeing every element of it. Successful examples of “choose your own adventure” type performance come to mind, like Sleep No More. My last observation from geeking out on 360 videos is that when I was panning through the video by moving my phone around, I realized how much my body was moving around as I did it - in a way, watching 360 videos became its own kind of dance. David's update This week, I have been working on importing, reading, and translating of the various digital map layers
I wanted to give Christina a short sample of the music. It isn’t the final, but it captures the general structure that Christina and I have been chatting about; tone, volume, and rhythm. The stream flow data (previous pos) was imported into R an then converted to map coordinates. Those coordinates are then used to identify specific pixels on each of the other datasets (spectral, elevation). The value of those pixels are then translated to tone (MODIS), volume (Night Lights), and rhythm (DEM). The translated value is dervied by finding the value of each pixel in a separate look-up-table (LUT) and replaced with that value. I can manipulate the LUT to change each of the musical attributes. However, before that information gets passed along to LilyPond, the translated notes need to written in the language that LilyPond can understand. Here is a segment of that computer code that outputs a .ly file that can be read in LilyPond. First, I identify the file and where to save it. Next all of the translated data gets concatenated for each line. 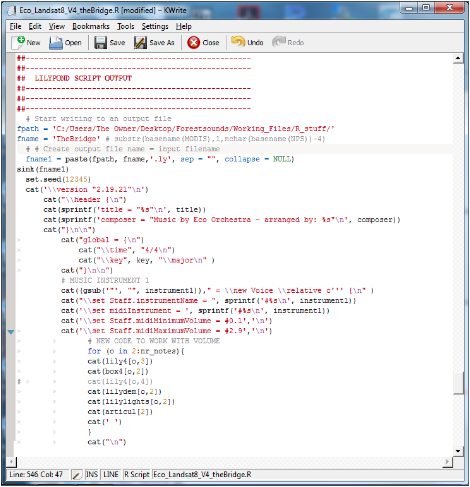 So for example, if I had pixel values for each of the map layers... MODISnir = 40 DEM slope = 100 Night Light = 5 I would end up playing a middle “C” quarter note played at mezzo piano. To play this in LilyPond, the text would read, C4\mp . Combining all of the values that were translated from digital map data the program can write sheet music and export to midi. Here you can see an example of the sheet music. I still have some bugs to fix in separate the individual measures out. LilyPond was made so that you could hand type your music, not automatically translate data. So I still need to have a feedback that checks the time signature with the amount of notes played. 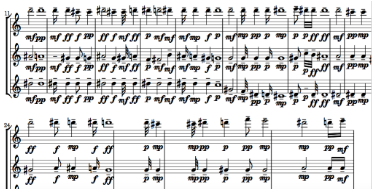 However, that does not interfere with the actual sound file.
Here is a short draft sample of music translated over the Susquehanna. For the sample, I reduced the length of the entire song, by skipping over a few pixels for each note. The next steps will be to revise and clean up the code and the LUTs. Christina's update This week, I spent some time familiarizing myself with the Susquehanna River - the river on which David is basing the composition he’s creating that we described last week. I thought I’d share some tidbits about the Susquehanna - some of the things I learned in my research so far that stand out to me.
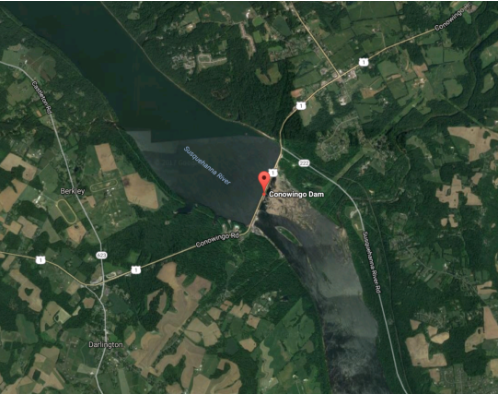 2. The Susquehanna’s 27,000-square-mile watershed contains parts of New York, Pennsylvania (nearly half the state), and Maryland. It is part of the larger Chesapeake Bay watershed, and as one of the larger tributaries of the Chesapeake Bay, the Susquehanna River supplies more than half of the fresh water that flows into the bay, as well as a great deal of its nutrient pollution, despite the Conowingo Dam.
3. Apparently the Susquehanna is geologically one of the oldest rivers on earth, predating not only the Appalachian mountains but apparently Pangea itself. In present day, it is one of the longest rivers in the country, and is the longest on the east coast after the Mississippi. 4. There was once a canal, the Union Canal, that connected the Susquehanna River to the Delaware River (the watershed that I live in), to provide more straightforward shipping access to Philadelphia. The canal was first proposed in 1690, constructed in the late 1700s, and decommissioned in the late 1800s. The canal is now preserved as a historic landmark. 5. The name Susquehanna is said to come from a native American tribe in the area, the Susquehannock, which translates to “People of the Muddy River.” 6. I found a great photography project in which Hannah Close, a Pennsylvania artist, documented the Susquehanna from upstream to down. 7. For some reason, a nineteenth century poem from a nature writing class I took in college has stuck in my head as one of the most immediate associations I have with the Susquehanna, and when I tell you why, I hope you find it as silly as I do. The poem is “The Merrimac” by John Greenleaf Whittier, and in it, he describes the beauties of the Merrimac River, in his native New England, by comparing it to other American Rivers he has seen, which though beautiful, don’t measure up (back here in 2016, the Merrimack River is also on American Rivers’ list, at #8). The whole 100+ line poem is in very exacting and precise rhyme, except for the lines about the Susquehanna - I always found this rather hysterical to imagine a straightlaced early American gentleman who just couldn’t think of a true rhyme for “Susquehanna” so threw in something zany. The passage is below. Home of my fathers! - I have stood Where Hudson rolled his lordly flood: Seen sunrise rest and sunset fade Along his frowning Palisade; Looked down the Appalachian peak On Juniata’s silver streak; Have seen along his valley gleam The Mohawk’s softly winding stream; The level light of sunset shine Through broad Potomac’s hem of pine; And autumn’s rainbow-tinted banner Hang lightly o’er the Susquehanna 8. I also discovered a delightful poem by Billy Collins, Fishing on the Susquehanna in July, in which he describes that the closest he came to fishing on the Susquehanna was actually looking at a painting in a museum in Philadelphia - another unexpected connection that the Susquehanna has made between David and I!
Christina and David’s update
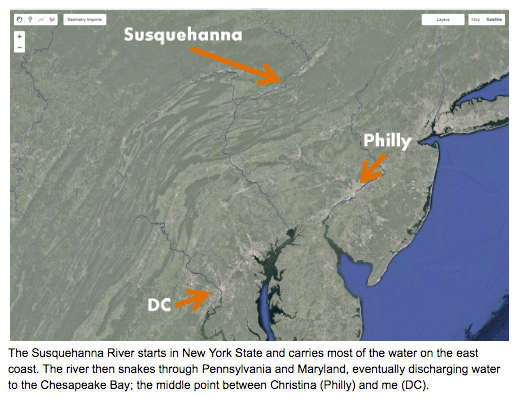
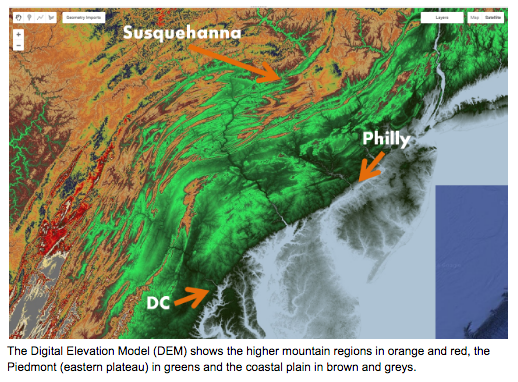
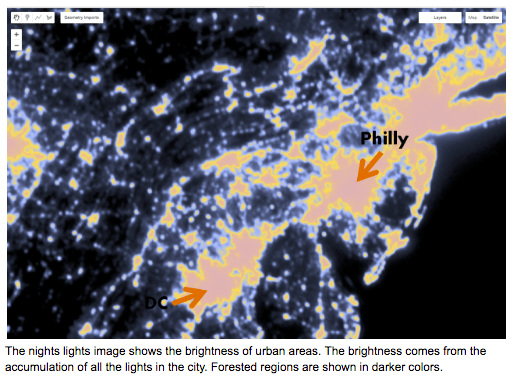
We had a nice post-holiday catch up this week - after spending quite a while in this residency looking at the interesting pieces and ingredients we have, I think it’s becoming clear to us how all the pieces fit together. David was sharing with me more about the new composition he has been working on, using the idea of moving from upstream to downstream that he has written about before. He chose to focus on the Susquehanna watershed - even though I don’t live quite in this catchment area, it’s a major watershed that connects Pennsylvania with downstream Maryland and DC, where David lives, and is part of the Chesapeake Bay watershed. Choosing a particular geography to focus on has helped me anchor myself conceptually as to the places we’re focused on, which will help me to develop movement in a more place oriented way. I am also getting really excited to hear David’s composition. I think the way he has chosen to suss out the characteristics of a river - interpreting slope into musical tempo and land cover into volume and harmony/dissonance - will help to tell a really interesting story of this watershed. So a small, forested, mountain stream in the headwaters will present as a fast-paced, yet quiet and harmonious musical phrase, while when the river gets flat and wide in downstream urban areas, the composition will be slower, louder, and more dissonant. What I plan to work on now is developing some core movement motifs reflecting on the Susquehanna River that can be varied according to how the musical composition is fluctuating in response to the music. My first thought was to have the dancer(s) move more quickly when the speed of the music changes, make their movement larger or smaller depending on the volume, and have more fluid, curved gestures and pathways in the forested areas but more angular ones in the urbanized ones - I may stick with this or think about other ways to vary the movement in response to the same parameters that David’s composition is doing. Below David shares some map screenshots that visually depict the qualities of the Susquehanna watershed that we’ll interpret through music and dance. 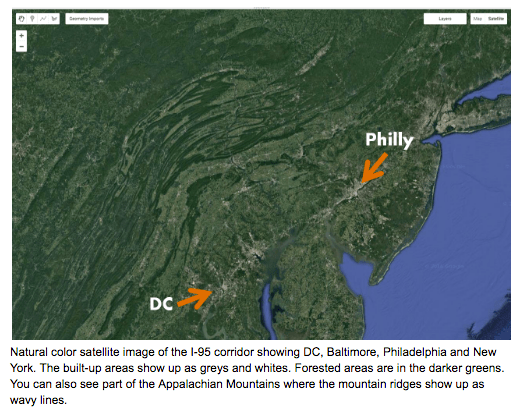
We also discussed using 360 video. Though this video concept may take some time to go from recording to 360 video, we think that this will enhance our 2D-to-3D theme to have varying level of interactivity. Here are some examples of 360 video in nature and in dance.
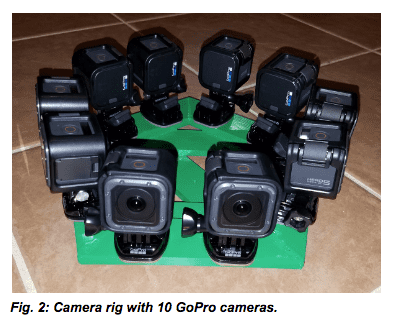
360 Video of Redwoods: 360 Kyle Hanagami Choreography: David's update This year I was able to make a trip down to Miami to see my family. Not as long as I wanted since I live so far away from them, but anytime I get to see my family is totally worth it. I had a restful holiday, I had a chance to disconnect from work to hang out with my family. We even got to do a hike in the Everglades to check out a degrading mangrove area (though the mosquitoes were relentless) 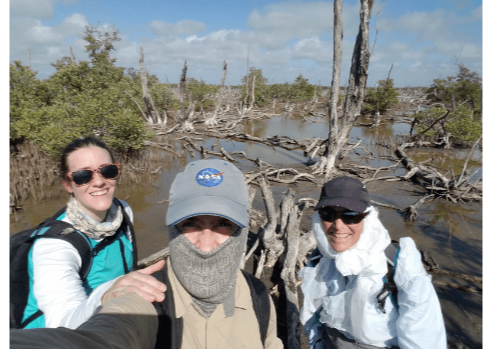 Fig. 1: My love, my mom, and me (and millions of mosquitoes) hiking in the Everglades Disconnecting for a bit helped me to organize my thoughts for the new year. In addition, I was able to make serendipitous connections with our project through minor events that occurred to me over the holiday. There were two specific ideas that came to mind that were centered around our (Christina and I) conceptualization of translating 2 dimensions into multiple other dimensions (think satellite image sonification and dance drawings). The first idea I just stumbled upon, or really just dropped into my lap. I accidently dropped a small portable speaker, those bluetooth ones that you can connect to your phone. As the speaker dropped, it spun around a bit before I was able to catch it prior to hitting the ground. Music was playing (Budos Band) as I dropped the speaker and sound was being projected in all different directions. This made me think about sound in space (previous blog post) and our perception of sound in the environment (think bird flying in the woods). This situation got me thinking about how Christina and I add multiple dimensions to the music. Christina’s dance drawings can help visualize aspects of the landscape, while the music represents the auditory perceptions. So not only can the programmed code translate map layers to pitch, timbre, and rhythm, but we can try to represent changes in the landscape by physically changing the direction of the speakers. The second idea that came to mind during the holidays was the visualization of 2D and 3D space. In a recent conversation between Christina and I, she brought up this great idea of remote dances that bring the mapped music to life. These could be in the form of a video. However, this is taking a 3D art (dance) into a 2D space (video). This got me to thinking. For work, I have been constructing a camera rig that can record 360 degree video (Fig. 2).
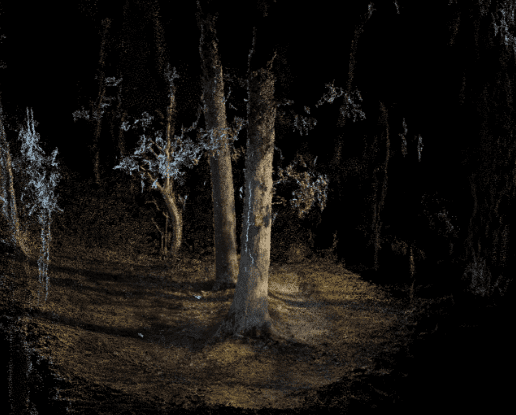 Fig. 3: This is a three-dimensional reconstruction of a small area of forest near my home. The reconstruction comes from over 400 still photos taken around the two prominent trees in the center of the photos. Using this reconstruction we should be able to accurately measure the thickness of the tree and the location and spacing between adjacent trees. That virtual 3D space represents the physical world and through the computer program (VisualSfM) you can fly through the environment in a way that is not humanly possible; seeing perspectives of the land from millions of different angles. What I am thinking now, is that it could be possible to give Christina’s dance drawings a new dimension, not only moving the 2D video of dance back into a perceived 3D (virtual world) but also by allowing the viewer to interactively move around the dancer. Christina and I have some catching up to do after the holidays, and I am looking forward to discussing these ideas and more with her this week. Christina's update
In my choreography, I am exploring physical spaces around water, unpacking ideas around the interface of human boundaries and infrastructure with the natural boundaries and dynamic equilibrium that water seeks. In 1890, celebrated explorer John Wesley Powell proposed that the new western state borders be defined by watershed boundaries, rather than the straight lines we now know. Rivers and streams are constantly changing course, redistributing energy and carving new paths to reach a dynamic equilibrium. Even the terms used to describe features of rivers are often verbs used as nouns – meander, reach, run, stream. But today, the continued disconnect between dynamic hydrological systems and the fixed, inflexible human structures and systems applied to them grows more and more troubling in the face of global environmental change. We continue to build in a way that doesn’t allow for change, with sea walls, flood walls, and gray stormwater infrastructure becoming the focus of our planning and investment, rather than the fluid, adaptive, resilient systems we need. In a parallel way, dance movement pathways are also not fixed, with some slight variations every time a choreographic phrase is performed. As a medium, dance is ephemeral, essentially fleeting and impermanent. For centuries, dancers and choreographers have wrestled with this, seeking ways to capture the essence of the moment of a dance in an enduring way, such as various modes of dance notation. I seek to create an anchor for dance, giving it more material presence in the art world. My exploration of dance drawings presents a new way to capture the dynamics of dance, making the typically invisible visible. David’s music also makes the typically invisible also audible. David is also working with changing the code of his music so that it reflects changes in the human versus natural landscapes based on light levels. I’m excited for us to work more on how these ideas interact. In particular, I’m interested to explore how the dance maps and the actual maps connect to each other. Perhaps the choreography is a mix of curved pathways and more angular pathways, as well as shapes. Perhaps it also modulates in response to light and sound levels, creating darker marks in the louder sections and treading more lightly in the softer parts. David's update This week I will be attending the American Geophysical Union’s Fall Meeting in San Francisco. The meeting is one of the largest gatherings of earth and space scientist in the world. Over 20,000 researchers attend this meeting. This year, I am presenting some of my recent research findings on detecting the growth of coastal forests (mangroves) as water along the coast eventually transitions from water to land. 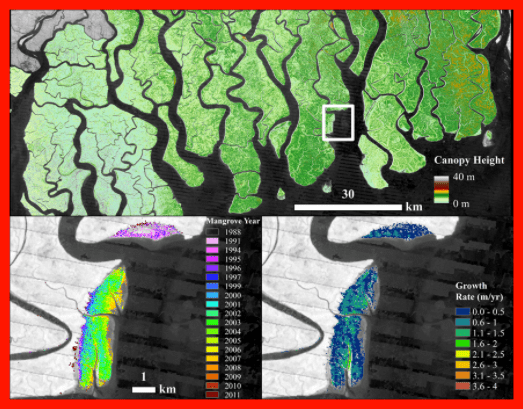 I have been studying the processes of coastal wetland systems for about 10 years now. For me these areas are enchanting landscapes. The Mayans even named a region Sian Ka’an: the translation, “Where the sky is born”. Coastal wetlands provide so many tangible and intangible benefits that many people overlook, even people that live right next to them. They provide habitat and protection for major fisheries and migratory birds. They help to break up powerful waves during strong storms, limiting the storm’s impact on the surrounding communities. They provide timber for building materials and charcoal for fires. For many indigenous communities, mangroves are part of their culture. On one of my field campaigns to Colombia was poetically summarized by a song written (and sung) by the community leader of a region in Choco, Colombia. He tells the story about how his community is supported by the mangrove forests; supplying the wood they need to build homes and supporting the fish and shrimp they need to eat. 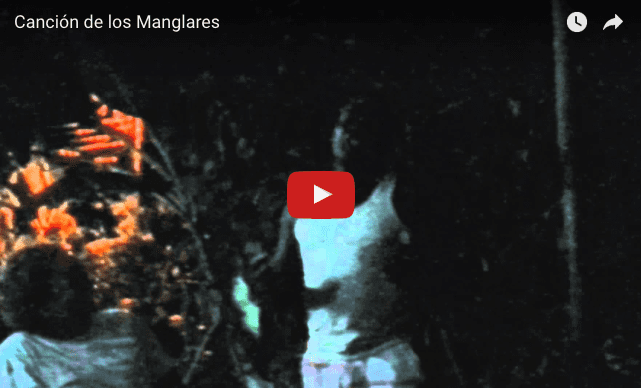 So this brings me to the point of this week’s post: Communication. Communication can be difficult. In any relationship, communication is key. It helps to resolve misunderstanding and helps to bring forward new information. My audience during the AGU conference this week is a bunch of scientist like me. Scientists have their own language in the form of charts, graphs, numbers, and maps. We can communicate relatively easily across borders and languages, just by using graphs. However, much like trying to understand another language, it can be difficult at first. Like asking “Donde está la biblioteca?” when you really need to use the restroom. Scientists also need to communicate their research to the public in a way that is much easier than charts and graphs or complicated jargon. The complementary nature of science and art can help bridge this gap in communication. Though I won’t be playing any of my satellite music at this conference, I will be taking in lots of different forms of communication from thousands of scientists. Christina and I have had our own ideas of communicating through art. Whether it’s Christina’s “Dance Drawings” or my sonification of satellite data, both are exploring ways to communicate earth surface processes. Christina and I have exchanged a lot of ideas back and forth about maps, dance, sound, music, and satellites. It has been fun exploring these ideas and it has provided me a new perspective on what I can incorporate into my music. For me, I think my next step is to revise my music code to be able to read a few different types of map imagery. I am really interested in creating a short music piece that brings together a lot of the concepts that Christina and I have been talking about. I also want to create a piece that Christina can really work with; something that is an experimental, but also something representative of the environment around us. So this is what I am thinking for our piece. First, I will use information on river networks (see previous post) to direct the music “downhill” along the river. The stream information was derived from elevation data collected during the Shuttle Radar Topography Mission. As the music program “moves downhill” it will translate each pixel into a note. In this case, I will use MODIS imagery instead of Landsat. One key difference between the sensors of these two satellites is that MODIS collects land surface information at a more coarse resolution. The larger pixel size lets us cover a larger land area with fewer pixels. We see (and hear) nature landscapes as soft, and somber sounds. We can listen to each bird sing; the wind rustle through trees. Cities on the other hand tend to be loud and chaotic. A cacophony of horns and chatter. My plan is to use information about the “intensity of city lights” to determine how loud the music will be. Because the MODIS sensors pass over the Earth during the day and night, we can also measure the brightness of city lights that brighten the night. The larger the city, the brighter the lights, the louder the music. Using some of the sound travel concepts I mentioned in a previous posts, the direction of the stream network will be used to determine where the rests or silence will be in the music. As the river moves away from the listener, that instrument will be not be played. I usually orient my maps with north up, so when the river moves northward, the music will be silent. Lastly, the Digital Elevation Model (DEM) collected by SRTM, will determine how long to play each note. Faster notes will be played during steep descents, while longer notes will be played over flat landscapes. Christina's update
Lately I’ve been giving a lot of thought to what David and I are ultimately building towards with this residency. I think we’ve exchanged a lot of ideas and thought about a lot of interesting possibilities, and it’s getting to be time to put the pieces together. What might it look like, in the end? Over the weekend David and I talked about a few different forms that our collaboration could take. One idea was a more traditional (in form) dance performance, in which I create a dance response to David’s music that also incorporates map imagery in some way. I have a lot of ideas of what this could look like, since this is the format I typically present my work in. But I started chewing on another idea that is more outside my typical way of creating. Working from the concept of presenting a live dance work, I started to think about my dance colleagues that I could recruit to work on the project with me and perform the work. I soon remembered, disappointedly, that most of the people that I think would be a good fit for this project no longer live in Philadelphia, so rehearsal and even performance scheduling might be difficult with the travel needs. But then I thought…maybe that isn’t an obstacle after all. Maybe they can stay right where they are. What if we don’t have to bring the dancers to the dance, but have the dance exist wherever the dancers are? David’s music is rooted in a specific place and geography - imagining a dance performance, I assumed at some point we’d decide on a particular location that we wanted to focus on, and create a response based on that. But part of what’s interesting is how different places will have different soundscapes, over both time and space. I started to think that a dispersed network of dancers was actually an asset, rather than an obstacle. I’m starting to imagine a dance map that lives in the digital realm. Dancers who reside in different places can upload videos of themselves dancing to the digital platform. In these videos, they dance in response to the Ecoorchestra music of their location. I can provide some essential movement motifs and directives, that allows for a cohesive vocabulary of movement yet allows for local variations as revealed in data and music. And the dancers could take it from there. I realized that, in my network alone, I know dancers all across the country, if not the world, who are all inhabiting different landscapes and geographies that could be animated in this way. I think this could be a really interesting way to enliven what David has been working on in sonifying the stream network data. I don’t have a clue, technically speaking, how to make the digital infrastructure needed to support an idea like this, but it’s something I want to unpack more and see what comes of it. David's update cOde to Joy Translating images to music requires, at least the work around that I am doing, a bit of coding in several different platforms. The images come from many different sources but all of them can be accessed through Google Earth Engine. There is satellite data available from NASA, ESA (European Space Agency), USGS, and NOAA, as well and data from a number of different institutions and researchers. The Earth Engine platform allows you to import, analyze, and export georeferenced images from a variety of sensors.  Yellowstone National Park. Background Map, False-Color Infrared (Trees in red), Elevation, Radar For my science work, I use the information from the images to measure specific details about the relationships between water, plants, and terrain. However, Earth Engine cannot translate my data into music (at least not yet). So once I select my image and the location that I am interested in (white line in gif), I export the information and bring it into another program, R. 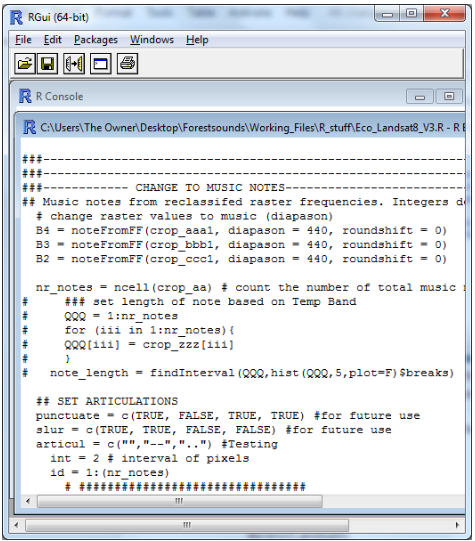 R is an open-source programming language that an a very large user-community. I usually don’t work with R, but I wanted to learn a new language and R has some of the right tools to convert the image data into music. Using a few available libraries, I can change the digital information into designated musical notes with rhythm, pitch, and articulation. library(tuneR) library(raster) library(rgdal) library(landsat) library(rLandsat8) R can generate a music files readily, but I also want to have the score generated along with the music. And in comes LilyPond. LilyPond is an open-source music engraving program that does exactly that, create musical scores and accompanying midi file. The program allows you to pretty much make every musical notation possible using different character combinations. LilyPond reads a .ly file with different character combinations for legato middle C or a staccato A, for instance. The image data that was translated to music notes in R, is a set of character combinations that LilyPond needs to create the midi file and score. The character combinations can be a little complicated to work with, especially dealing with the automation of a unique (.ly file) from R. I am still working out the bugs that can creep in because of the conversion from image data to the .ly file. 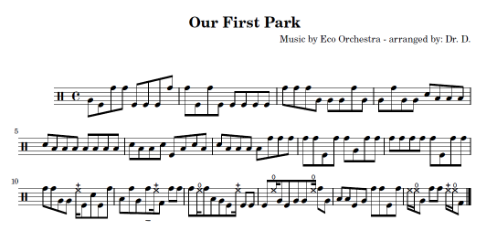 Example of the partial score for and Our First Park; an ode to Yellowstone National Park. With all the ideas that Christina and I have been discussing back and forth, I really want to start connecting the pieces from each of our previous posts: river drainage network, the movement of sound, exploring the parallel patterns in image and sound, and the sound of silence. Christina's update This week I started to play with dance movement in response to some of David’s remote sensing maps. I wanted to share a small sequence that is very much a work in progress. The map below depicts deforestation. In my choreography, I responded to the contrast of the blue (forested) areas with the smaller meandering streams with slower, more methodical movements and curving shapes. The larger river in the center feels like a dramatic disruption, and markedly different in its straight, wide path. I responded to this part of the image as well as the more jagged edges in the top right with faster and more abrupt motions and more angular, linear shapes. 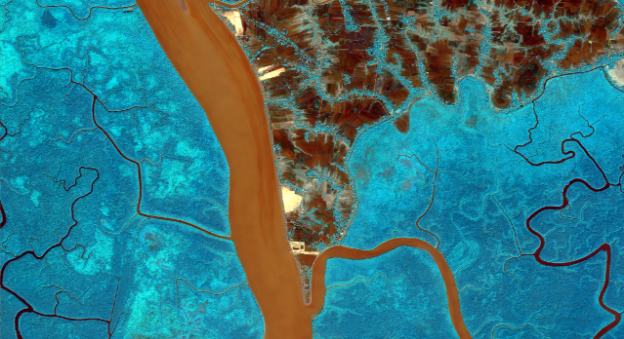 I worked on this snippet in the absence of music this time, responding solely to visuals - as I work on this more, I’m interested to figure out how the visual signatures play out in David’s music compositions, and how all three can come together to create something impactful and representative of a landscape. David's update Silence in the World of Data There is so much noise around us. We are filled with a world that is competing for your attention. Talking heads on TV. Pop-up ads. Construction. Traffic. People arguing over who should be president is just a bunch of noise. Adding silence to the conversation allow both voices to be heard, to be interpreted, to be understood. This reminds me the Simon and Garfunkel song, Sound of Silence. “And in the naked light I saw Ten thousand people, maybe more People talking without speaking People hearing without listening People writing songs that voices never share And no one dare Disturb the sound of silence” Silence helps to make sense of the noise around us. It helps to reduce the clutter between sounds and accentuate patterns in the world around us. Data can have lots of noise. Too much background information can drown out the signal you are trying to measure. The term signal-to-noise ratio is the relative contribution of the information that you want to measure and the amount of background noise that is also recording 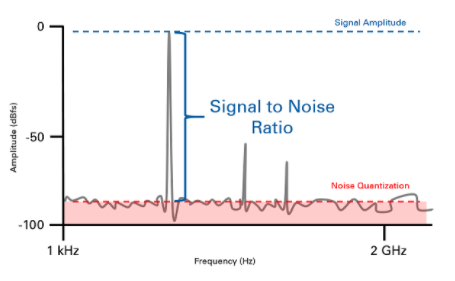 For example, radio frequencies can interfere with radar sensors. To deal with that noise, we can apply various smoothing and filtering techniques to reduce the effects of the noise leaving a much stronger signal that can be recognized and interpreted. Music uses silence is similar ways. The absence of sound removes the clutter of the notes to reveal the melody, harmony, and rhythm. Silence is the pause for communication, interpretation, fear, excitement, or enlightenment. 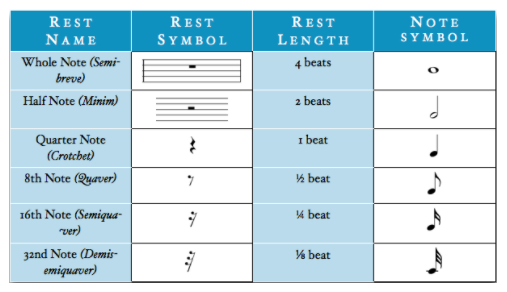 In my exploration of the translating satellite imagery and spatial data into music, I have left out the silence. There are many examples of the sonification of data where musical silence represents the absence of a data point. However, in gridded data, like that from satellite imagery, there can be data in every pixel. In order to make the silence a meaningful representation (not an accurate representation), I will have play around with other map layers. These layers could be stress indices, rainfall/temperature patterns, or signal-to-noise values as measured from the satellites. Trying to represent silence in a world of data can be difficult. As Christina and I move forward with our project, I think we will have to figure out what the right combination of sound and silence. Christina's update
Silence in the World of Dance I’ve reflected before on the almost inextricable relationship of dance to music, but silence also has deep importance. Some of the most powerful dance works I’ve seen have been performed in either partial or complete silence. I think this power comes from the fact that the dance has to stand fully on its own without a powerful piece of music to back it up. Stripping away the atmosphere that music provides allows the movement itself to have more power. As a performer, dancing in silence is very different from dancing to music. Instead of needing to stay on the music, a dancer has to cultivate an internal rhythm and timing, and if it’s a group piece, we have to have strategies for all the dancers to stay coordinated and together. Something I also love about silence is that it allows the sounds of the dancer and the dance itself - you hear the brushing of arms, the clasping of hands, the friction of feet on the ground, and (my favorite) the breathing of the dancers. We have a notion that some dance, particularly ballet, must have an illusion of being effortless and perfect. Silence allows us to pull back that curtain of ease and not just see but hear the work and the physicality behind the dance. In developing choreography, the use of stillness can be understood as a kind of dance silence. It’s always a balance of using movement and stillness. Sometimes, the tendency can be to pack a ton of movement into a piece, but even when the movement is compelling, it can be tiring as a viewer (not to mention a dancer) to watch a piece that is densely packed with movement and no breaks. Like David wrote, stillness helps us to make sense of of the movement we’ve seen, as it stands in such stark contrast with motion. The space between movements is important as the movement itself. David noted that his Ecoorchestra pieces have not included silence to date - as he considers how to incorporate that meaningfully into his compositions, I too will be considering the balance of stillness and movement in my choreographic response, and how dance can respond to both silence and noise. |
Visit our other residency group's blogs HERE
David Lagomasino is an award-winning research scientist in Biospheric Sciences at the NASA Goddard Space Flight Center in Maryland, and co-founder of EcoOrchestra.
Christina Catanese is a New Jersey-based environmental scientist, modern dancer, and director of Environmental Art at Schuylkill Center for Environmental Education.
|