|
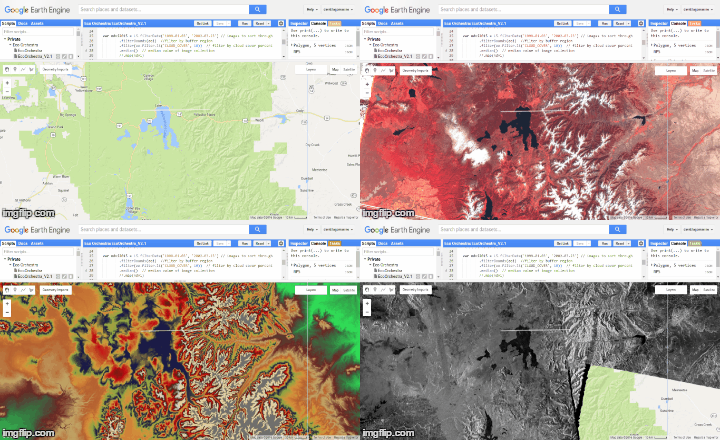
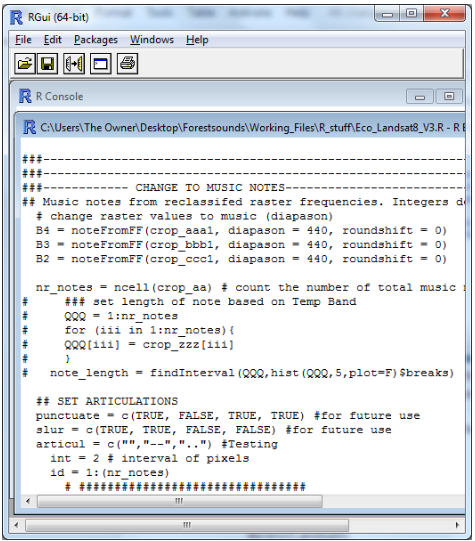
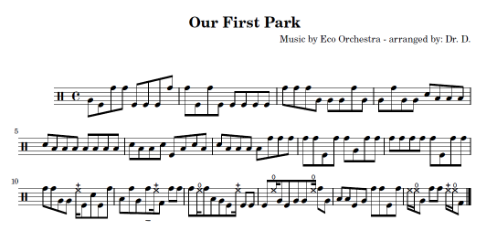
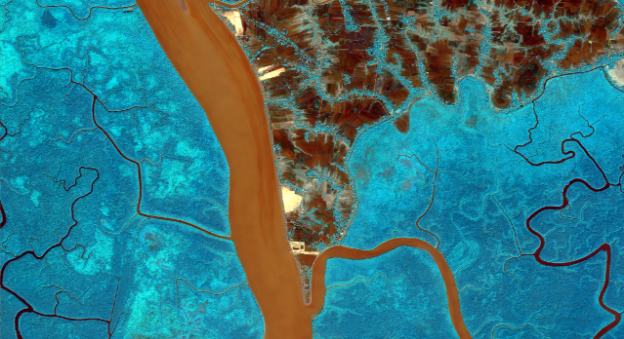
David's update cOde to Joy Translating images to music requires, at least the work around that I am doing, a bit of coding in several different platforms. The images come from many different sources but all of them can be accessed through Google Earth Engine. There is satellite data available from NASA, ESA (European Space Agency), USGS, and NOAA, as well and data from a number of different institutions and researchers. The Earth Engine platform allows you to import, analyze, and export georeferenced images from a variety of sensors. Yellowstone National Park. Background Map, False-Color Infrared (Trees in red), Elevation, Radar For my science work, I use the information from the images to measure specific details about the relationships between water, plants, and terrain. However, Earth Engine cannot translate my data into music (at least not yet). So once I select my image and the location that I am interested in (white line in gif), I export the information and bring it into another program, R. R is an open-source programming language that an a very large user-community. I usually don’t work with R, but I wanted to learn a new language and R has some of the right tools to convert the image data into music. Using a few available libraries, I can change the digital information into designated musical notes with rhythm, pitch, and articulation. library(tuneR) library(raster) library(rgdal) library(landsat) library(rLandsat8) R can generate a music files readily, but I also want to have the score generated along with the music. And in comes LilyPond. LilyPond is an open-source music engraving program that does exactly that, create musical scores and accompanying midi file. The program allows you to pretty much make every musical notation possible using different character combinations. LilyPond reads a .ly file with different character combinations for legato middle C or a staccato A, for instance. The image data that was translated to music notes in R, is a set of character combinations that LilyPond needs to create the midi file and score. The character combinations can be a little complicated to work with, especially dealing with the automation of a unique (.ly file) from R. I am still working out the bugs that can creep in because of the conversion from image data to the .ly file. With all the ideas that Christina and I have been discussing back and forth, I really want to start connecting the pieces from each of our previous posts: river drainage network, the movement of sound, exploring the parallel patterns in image and sound, and the sound of silence. Christina's update This week I started to play with dance movement in response to some of David’s remote sensing maps. I wanted to share a small sequence that is very much a work in progress. The map below depicts deforestation. In my choreography, I responded to the contrast of the blue (forested) areas with the smaller meandering streams with slower, more methodical movements and curving shapes. The larger river in the center feels like a dramatic disruption, and markedly different in its straight, wide path. I responded to this part of the image as well as the more jagged edges in the top right with faster and more abrupt motions and more angular, linear shapes. I worked on this snippet in the absence of music this time, responding solely to visuals - as I work on this more, I’m interested to figure out how the visual signatures play out in David’s music compositions, and how all three can come together to create something impactful and representative of a landscape.
0 Comments
Leave a Reply. |
Visit our other residency group's blogs HERE
David Lagomasino is an award-winning research scientist in Biospheric Sciences at the NASA Goddard Space Flight Center in Maryland, and co-founder of EcoOrchestra.
Christina Catanese is a New Jersey-based environmental scientist, modern dancer, and director of Environmental Art at Schuylkill Center for Environmental Education.
|

