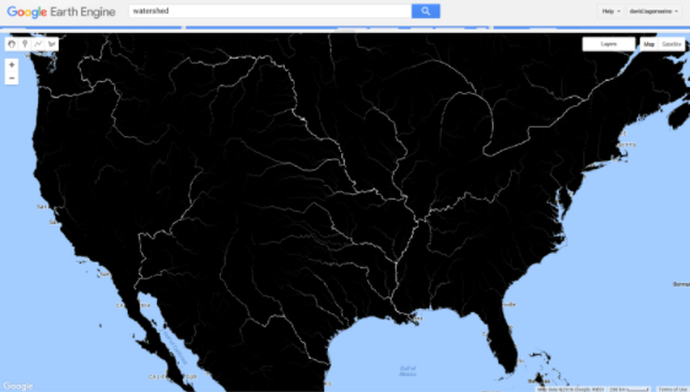
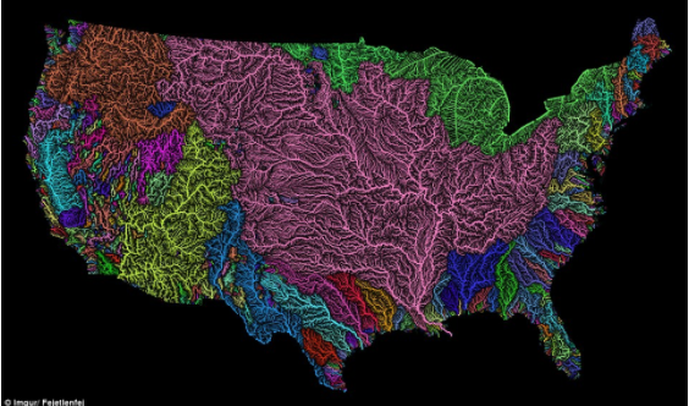
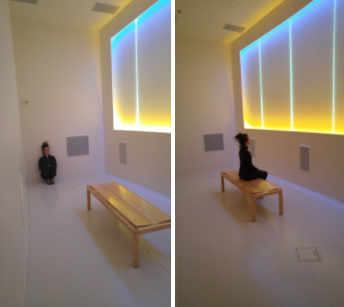
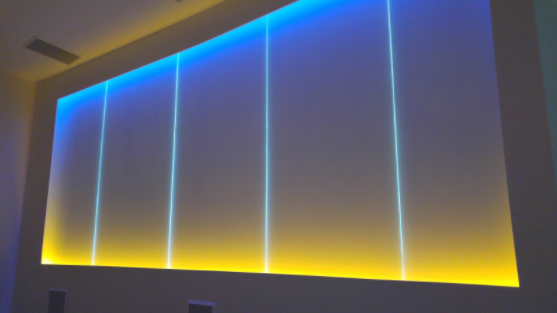
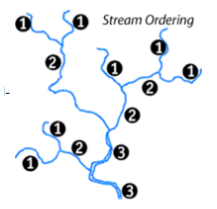
 Fig. Generalized stream order classification Fig. Generalized stream order classification David's update Path of Least Resistance Water flows downhill. The path the water takes is affected by the geology, but most importantly, gravity. As more and more water accumulates, the larger the channel, tributary, or stream becomes. The smallest streams are called first-order streams. When lower-order streams connect, the order number goes up (Fig. 1). When a stream reaches seven orders, it is then considered a river. The Amazon River is a 12th-order stream. I bring up the concept of elevation. streams, and rivers because I have been thinking a lot about the translation of spatial data into music. Christina first brought up this idea in one of our early conversations. For her choreography, she likes to understand different aspects of the the music; knowing the starts and stops; identifying details within the music. This is her mapping of the music. One important question she had was, “how is the music translated?”. In other words, where is the music coming from on the map (gridded space). My answer was relatively simple, “from a line drawn across a grid”. These lines were primarily arbitrary, but I did chose where to draw the line. The data pixels that were overlain by the line are then read in order; one pixel = one note. However, with some recent datasets I have been working with and speaking to Christina, I plan to let the land, or the digital replica of the land, determine the direction which the music is translated. In my research, I am looking at the relationship between watersheds and change along the coastal areas. In the image below (Fig. 2), you can see the major rivers in the US. The information in this image was derived from data collected by the Shuttle Radar Topography Mission in 2000. This satellite sensor was deployed from the Space Shuttle Endeavor during an 11-day mission to measure the elevation of the earth at a 30meter x 30meter grid. The elevation data can then be converted to a flow direction, which is based on the relative height between each pixel. The direction data then help to determine the accumulation of “pixels” that “drain” into adjacent pixels. And this brings me back to the streams and rivers. I like the idea of letting the streams and rivers set the direction of the music. The pitch and rhythm would still come from the spectral data, like I mentioned in the previous post, the order of the notes will just be determined by elevation data. Sometimes you have those moments that you think your computer, or Facebook, or google are listening to you. I had that moment this week. All these ideas about rivers and the “flow” of music, the same dataset that I was using, showed up on a Facebook post. In particular, it was an artist and GIS expert (Geographic Information System) that used an elevation map to highlight the different river basins within the US. Each color in Fejetlenfej’s map is a different river basin. The Mississippi Basin is easily distinguishable in the pink in the center of the US. Christina's update This week, I’ve been continuing to chew on ideas around music, sound, data, and natural systems. This summer, I was lucky to spend three weeks in south-central Alaska, and got to see John Luther Adams’ permanent light and sound installation, The Place Where You Go To Listen, at the Museum of the North. Adams is one of my most favorite composers, so this was somewhat of an artistic pilgrimage for me. This work interprets real-time geophysical data into sound and light. Depending on the time of day, weather conditions, and time of year, the colors shift and the harmonies expand and narrow in response to the amount of daylight. If there is seismic activity, even if unnoticeable by humans, the bass drums rumble. Bell-like sounds ring high in the room if the aurora borealis is active. Even the moon rises and falls, in sound. The room is always changing, in response to what is happening in the world outdoors. I spent a lot of time in The Place, listening. Though it wasn’t the most dynamic day - it was a brilliant sunny day, too early in the year for the aurora, and there were no earthquakes, even small ones - it was an amazing opportunity to reflect on what is uncovered and revealed by turning these data streams into all-encompassing place-based music and enveloping light. Besides the brain food, my souvenir was a book Adams wrote documenting and reflecting on the process of creating the place, which I’ve been reading and has been a wonderful companion in this very process-based residency. It has given me a lot of thinking fodder about the how and the why of turning data into music, and how dance/movement can add another layer of interpretation to it. The first chapter of this book is available as an essay here, and worth a read.
Adams writes, “As a composer it is my belief that music can contribute to the awakening of our ecological understanding,” taking ecology to be a study of patterns and connections that he makes manifest through music. Adams searches for an ecology of music, and I think, for David and I, a cartography of music is a related pursuit. Another passage of Adams’ I found interesting in our context: “If music grounded in tone is a means of sending messages to the world, then music grounded in noise is a means of receiving messages from the world...Rather than a vehicle for self-expression, music becomes a mode of awareness.” This really resonated with me as far as data that is generated from data, which, though it has important points of human input, it is less an expression of the composer themselves and more an expression of concepts. In a way, it is a more humbling way to work as an artist, in service of something greater than your own creative ego or agenda. Adams wraps up this essay with some reflections on art and science, and what he sees as their similarities, differences, and ways they come together. “Art and science also embody two minds, two ways of understanding the world in which we live. Yet these two minds share a more fundamental unity than we sometimes recognize. And they have much to say to one another, especially in our times.” Art and science certainly do, and so do David and I!
1 Comment
Leave a Reply. |
Visit our other residency group's blogs HERE
David Lagomasino is an award-winning research scientist in Biospheric Sciences at the NASA Goddard Space Flight Center in Maryland, and co-founder of EcoOrchestra.
Christina Catanese is a New Jersey-based environmental scientist, modern dancer, and director of Environmental Art at Schuylkill Center for Environmental Education.
|

