|
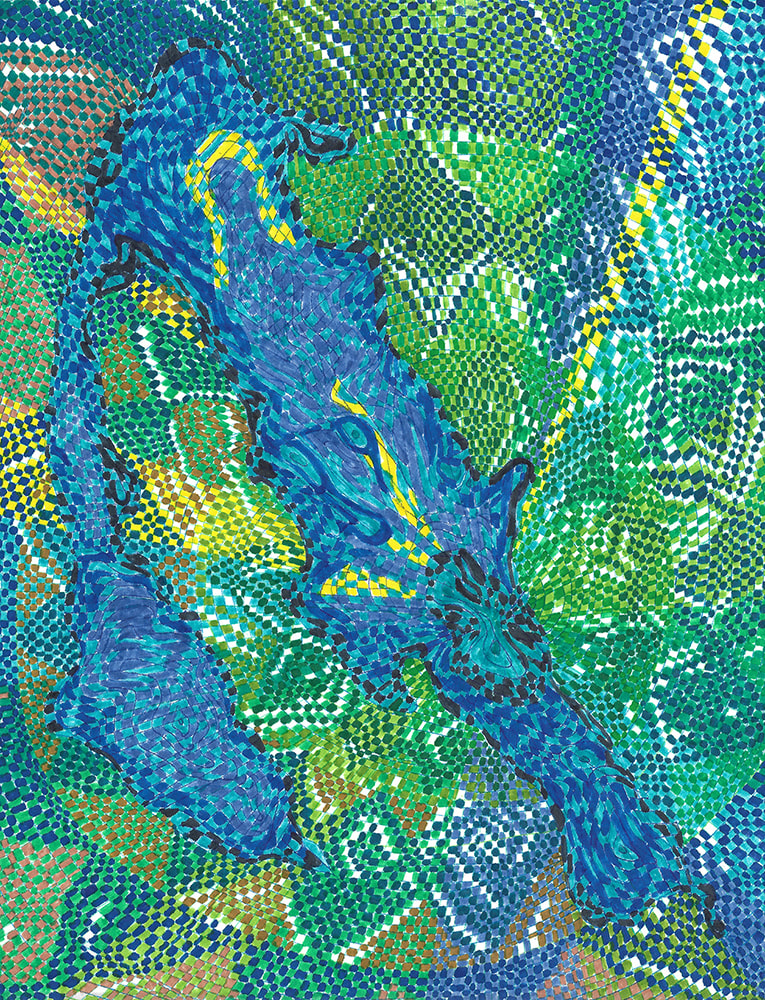
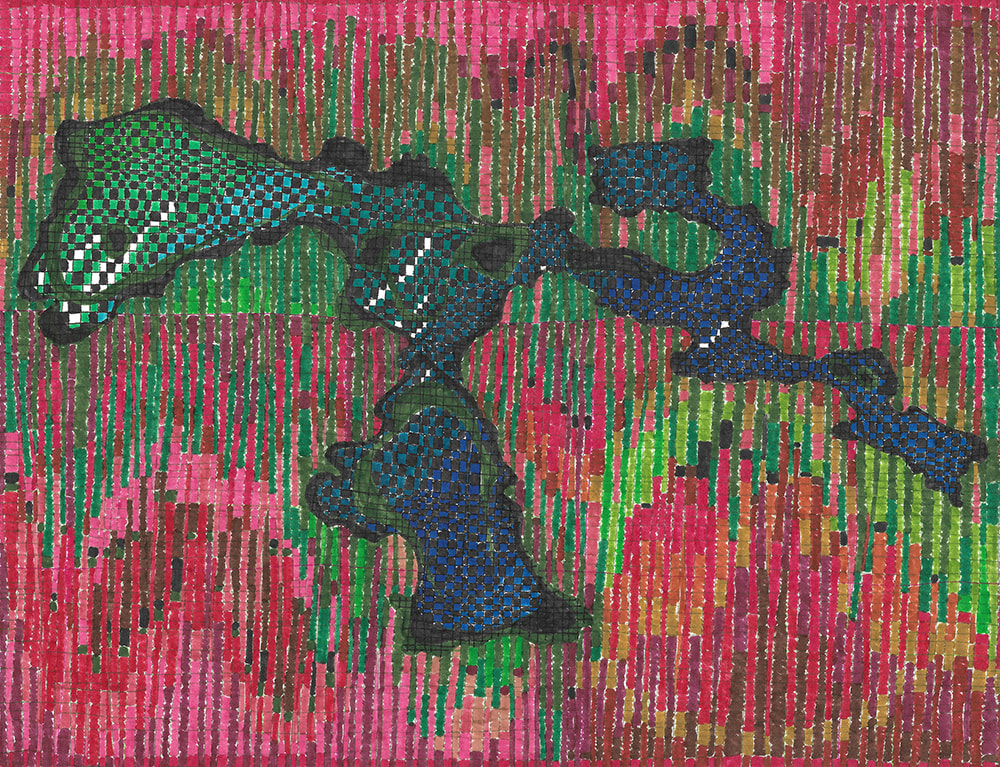
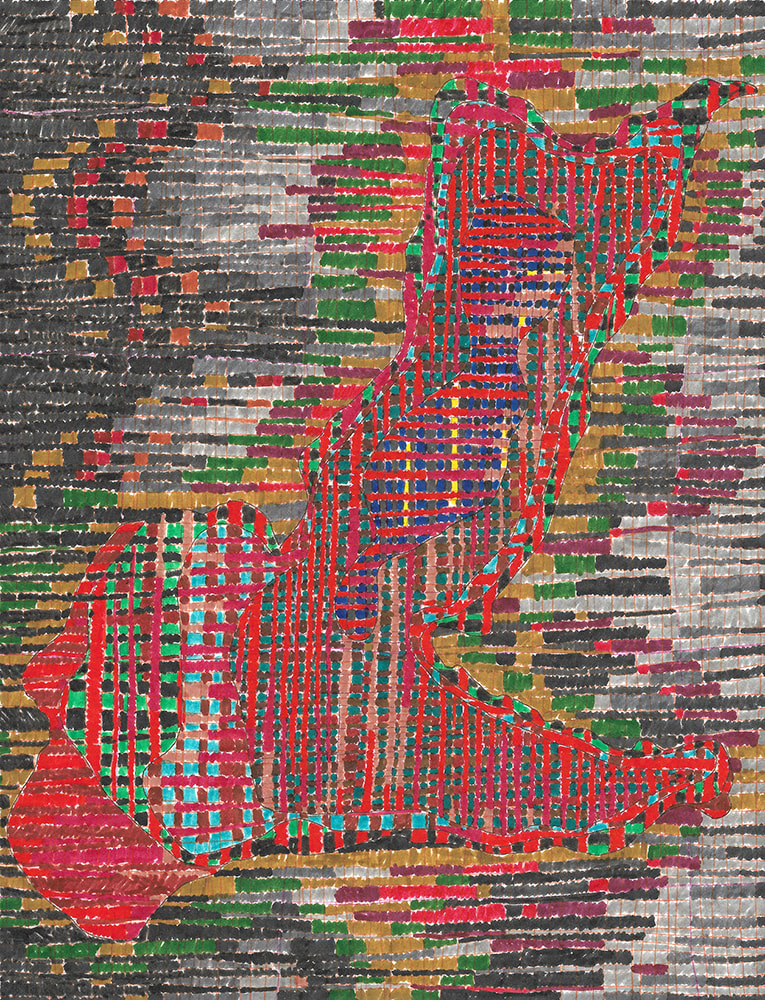
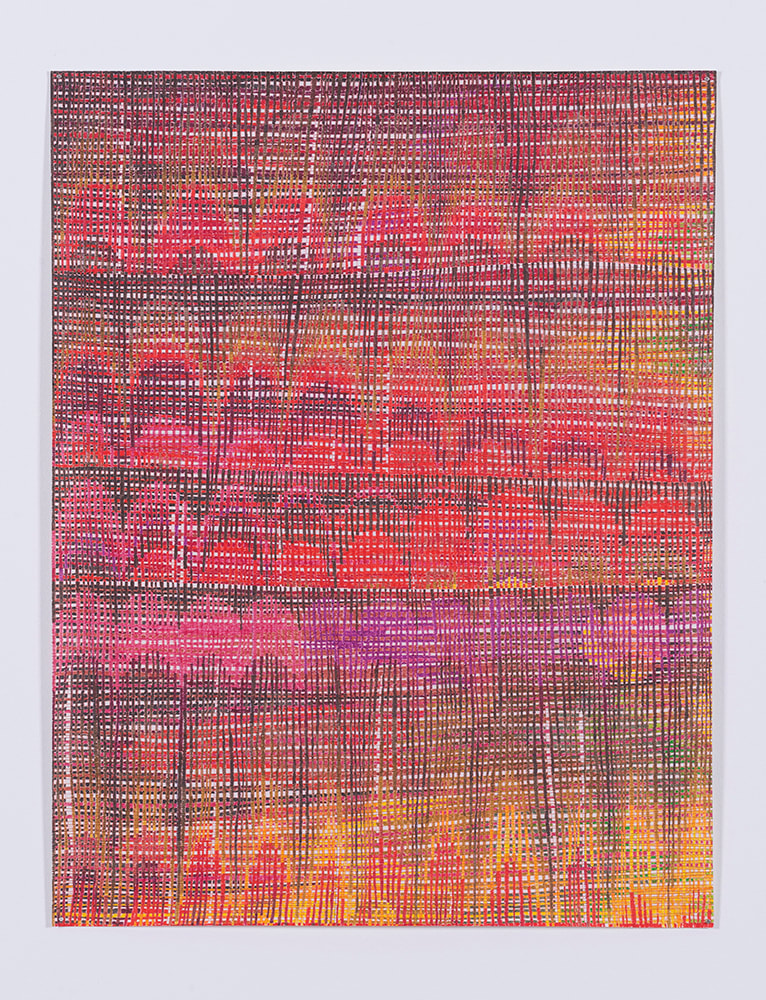
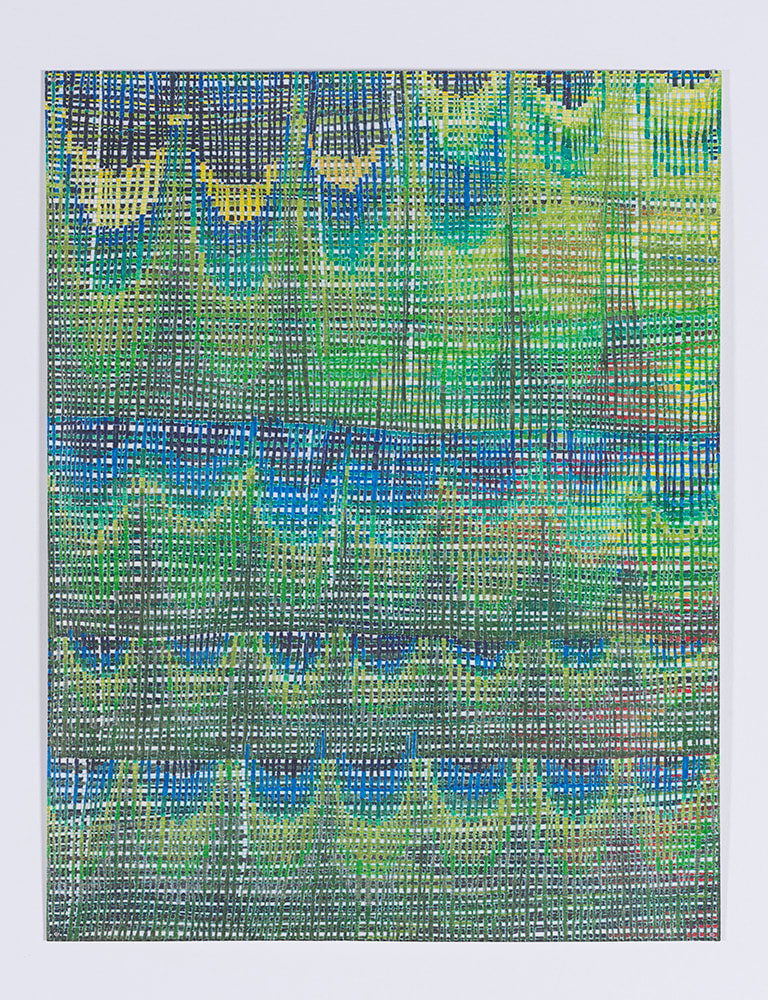
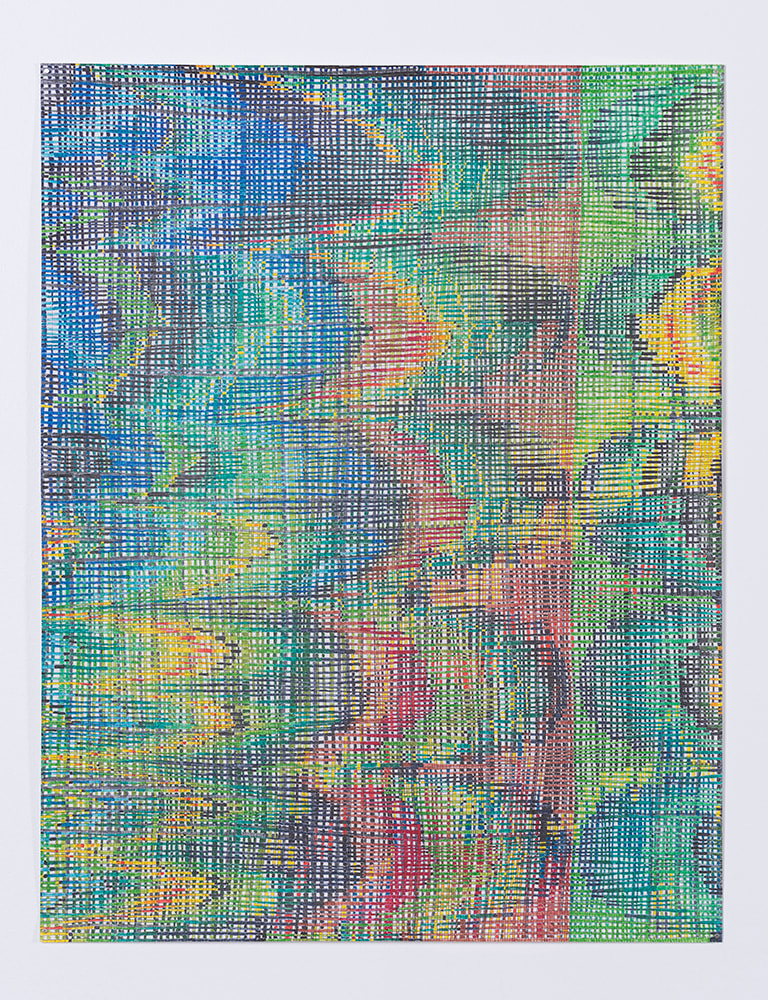
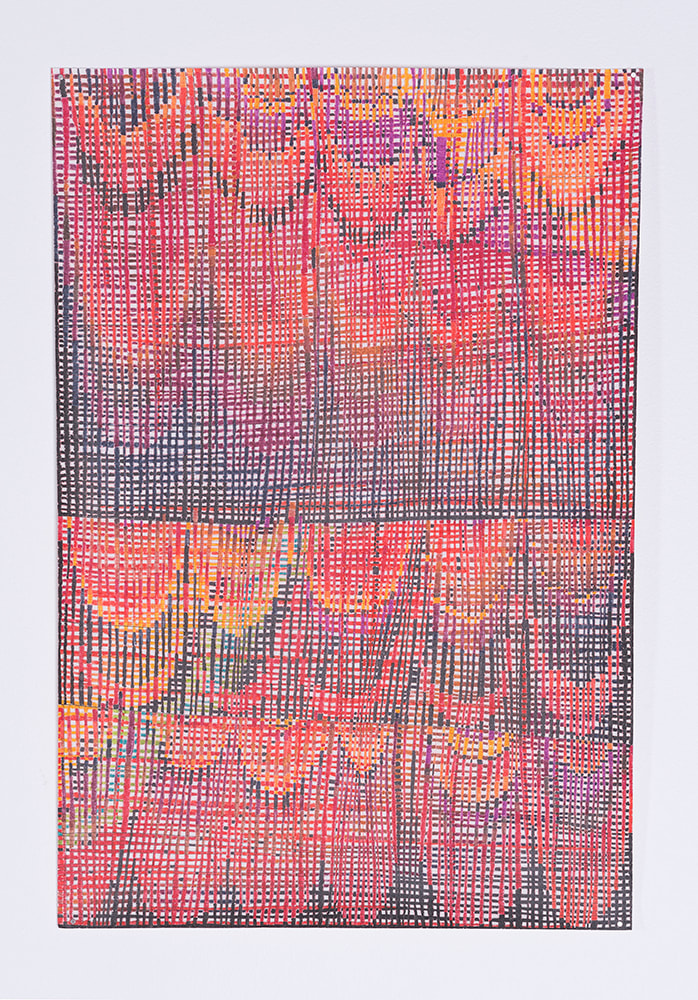
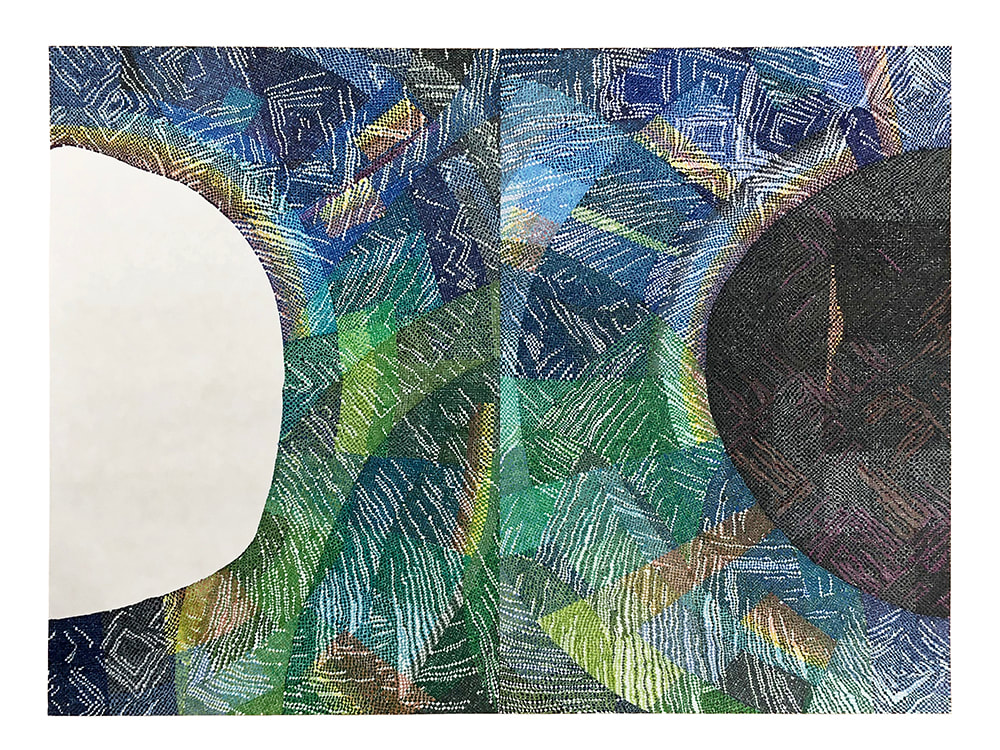
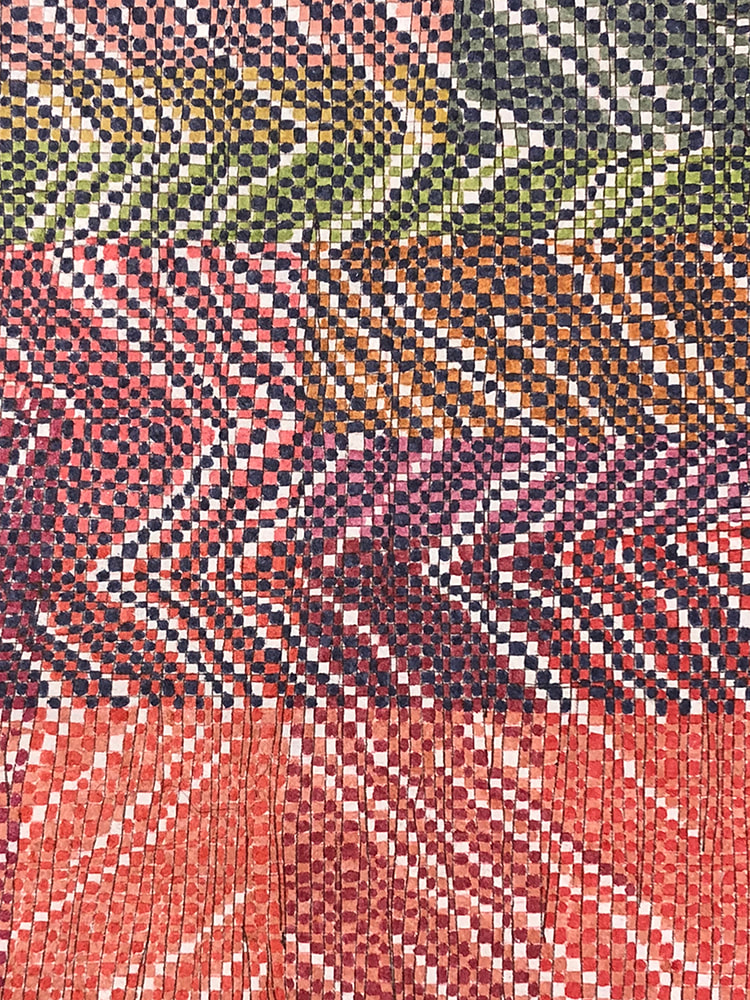
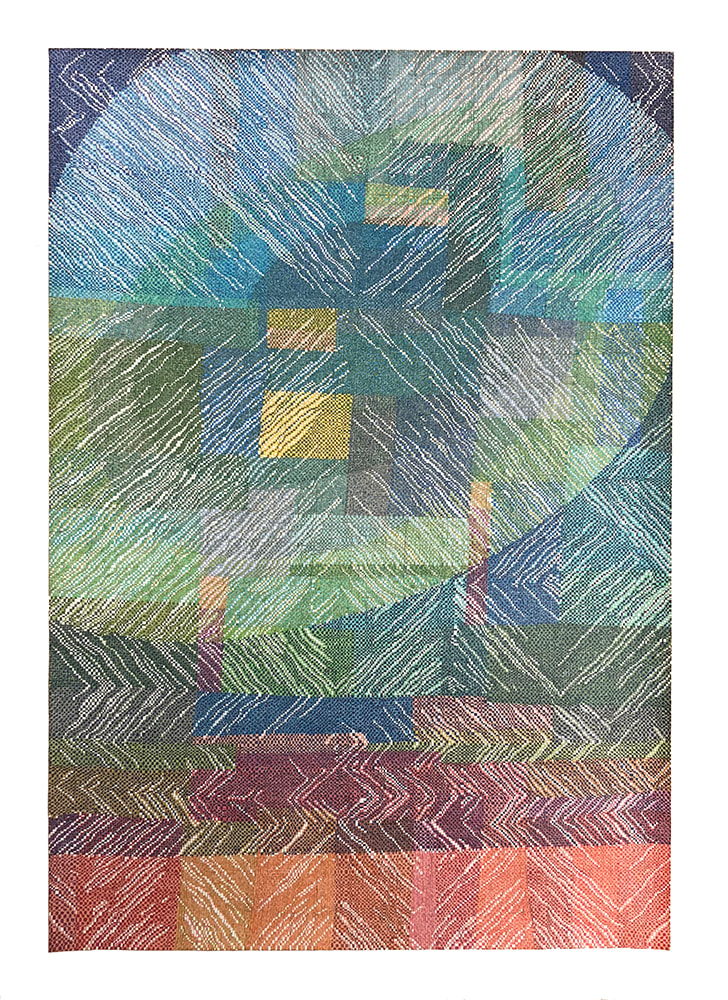
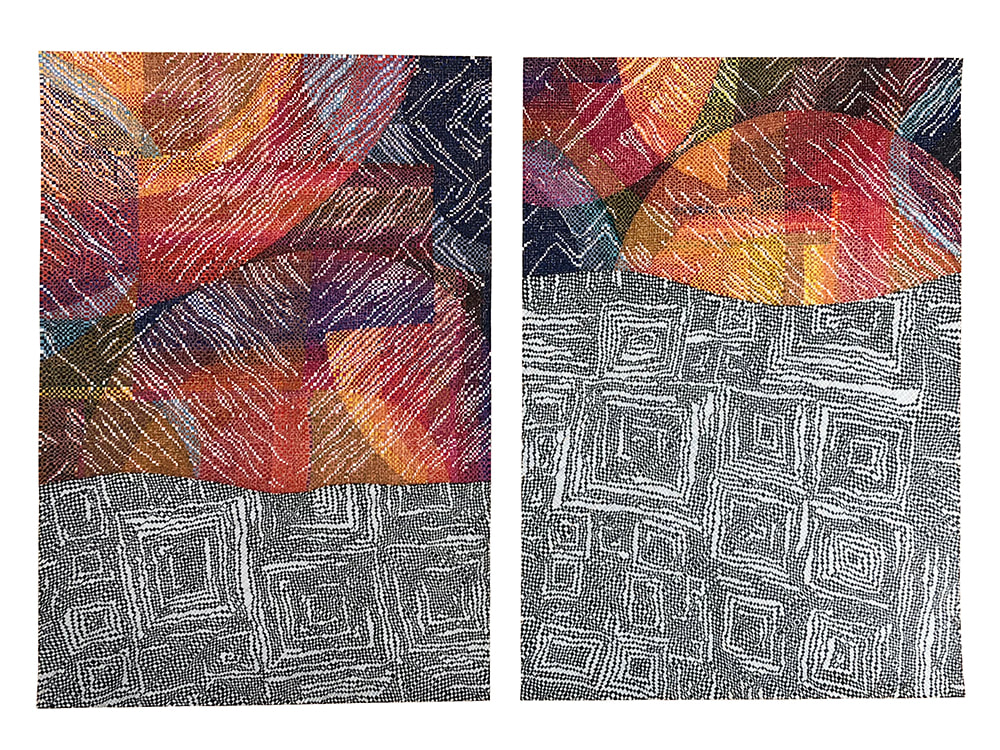
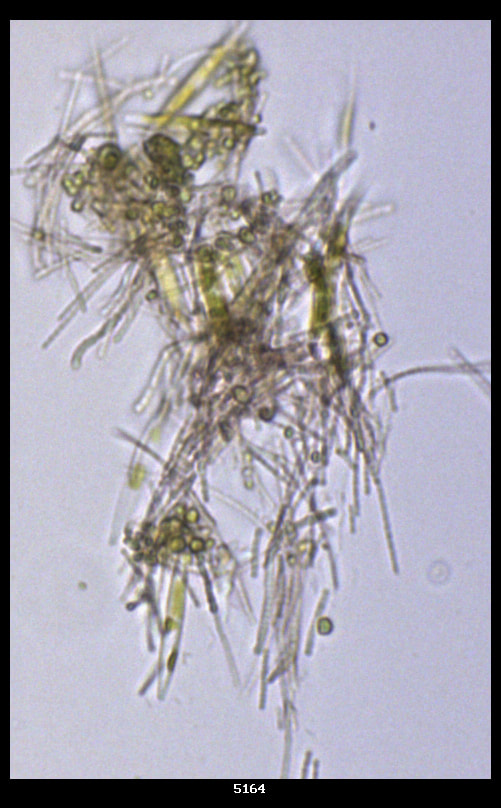
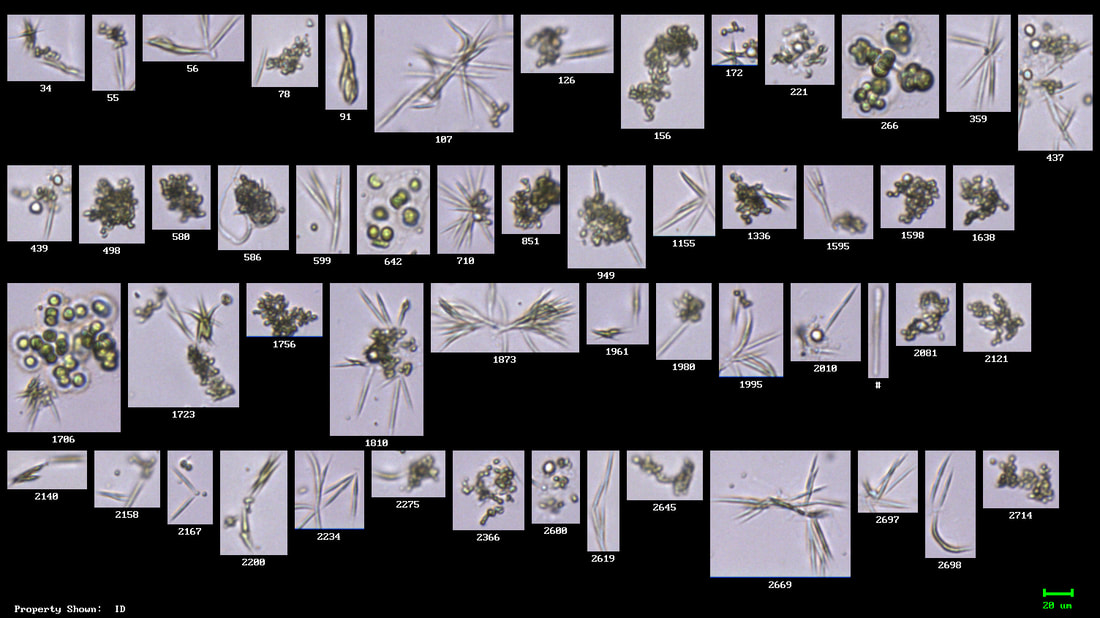
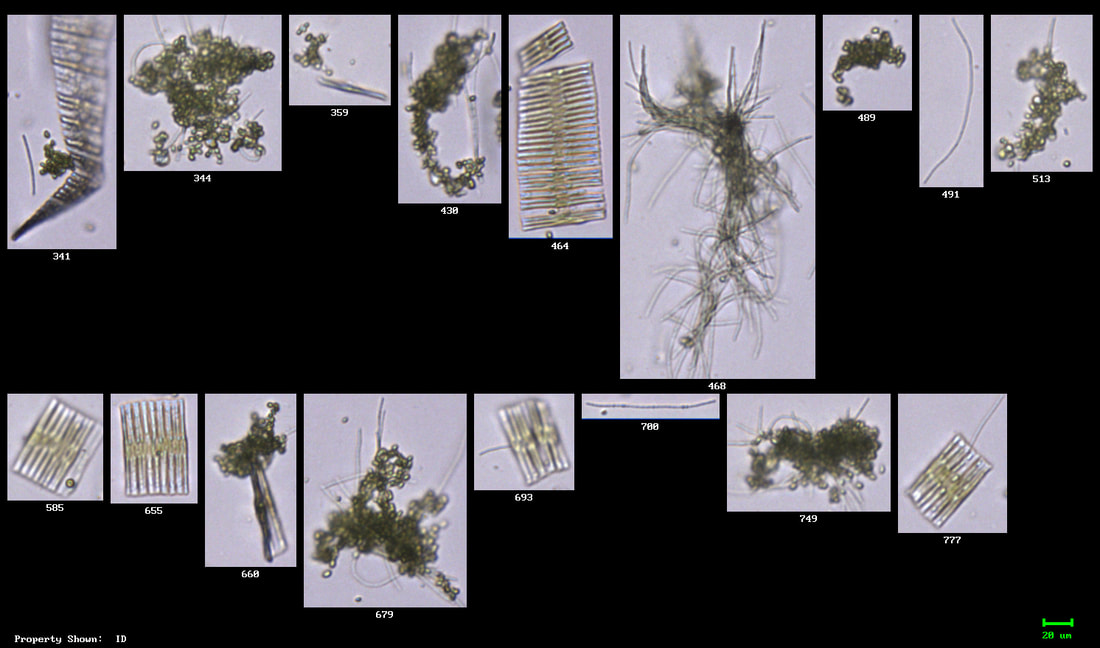
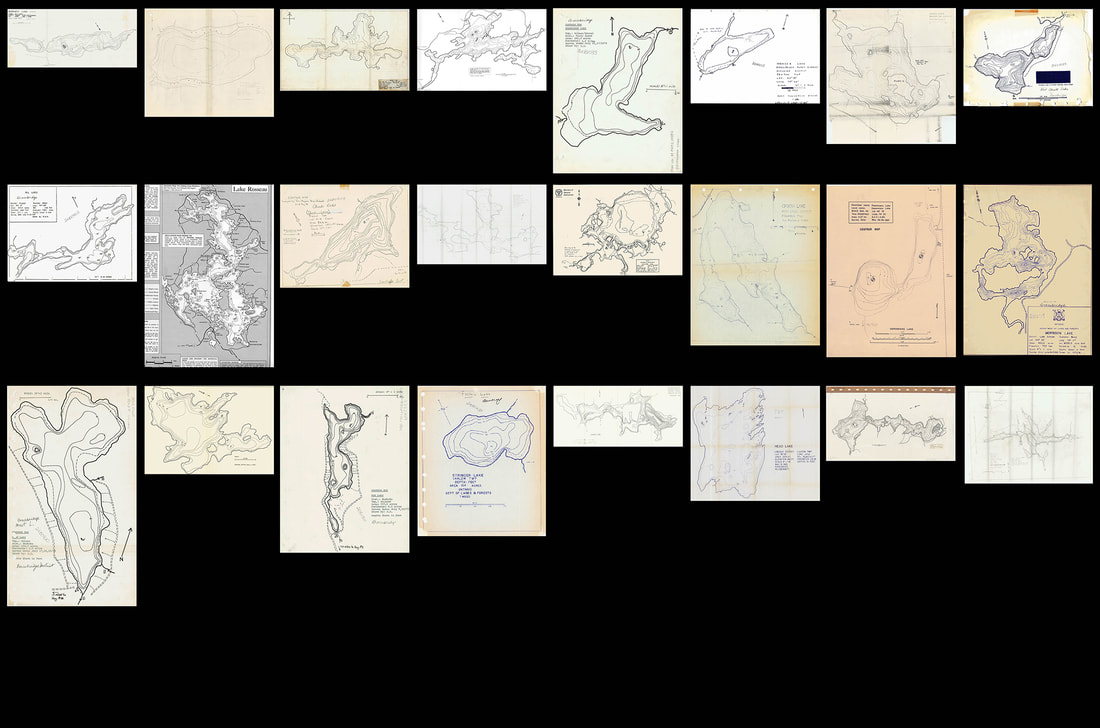
Tali A few weeks ago, Oscar sent me some basic information about three of the lakes where he did research. For each lake, I received a depth map, a few images of the algae in that lake, a short text on the lake’s relevance in the context of our conversations, and a bit of data. My plan was to integrate these research components (the data, map, and algae photos) in order to create three drawings, one for each lake. What I ended up with, instead, are really just initial sketches. They are drawings made in an effort to think through/process/try to find a personal connection to the research—not cohesive integrations of that research. Between receiving the source material and starting the drawings, I moved across the country and am now living in New Mexico’s desert. Beyond the usual disruption of moving, I found it challenging to work on this project in the desert. In the past, my drawings have been—while seemingly abstract—based on direct observations of a place or memories of a place. Without this direct observation of a similar landscape and having never been to this part of North America, I struggled to feel confident in my selection of colors and patterns as I worked. I feel somewhat ambivalent about how they turned out. Nevertheless, here they are. Each drawing is 8.5”x11”, india ink on paper. I started with the depth map of the lake and then layered my responses to Oscar’s narrative accounts of that lake.
0 Comments
Tali
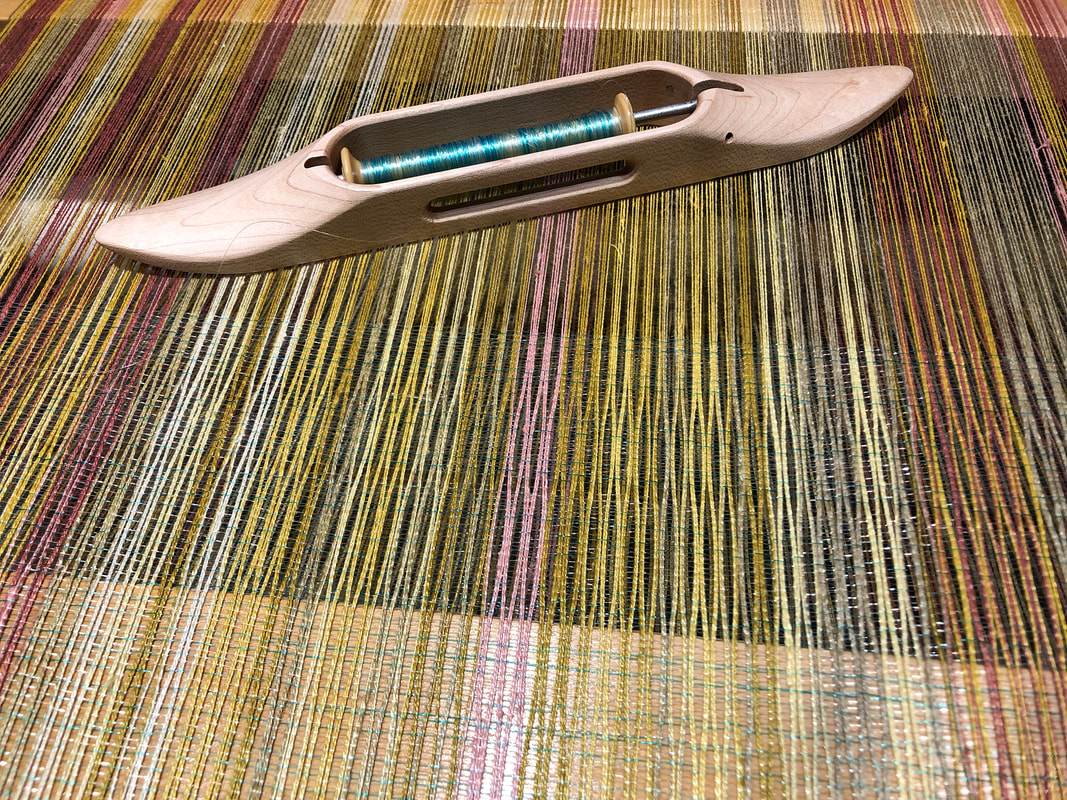
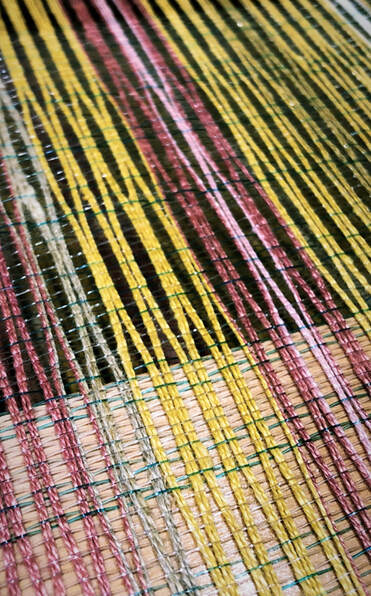
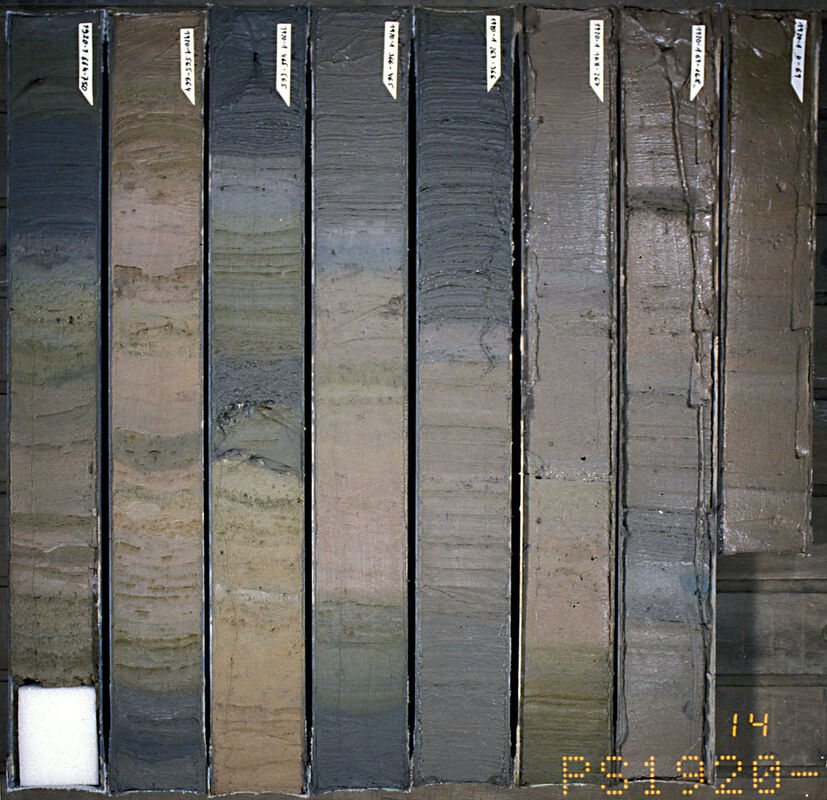
Oscar and I are both in the midst of moving which has interrupted our collaboration. Despite the slowdown, in our conversation yesterday we settled on the details of the project we will be working towards over the next month. I will be creating a series of three drawings that reflect on the various themes that have arisen in our dialogue over the last several months. Each drawing will start with the layering of shapes from a lake where Oscar was conducting fieldwork and from one of the algae slides that were part of that field work. Oscar will provide me with the pairs of images, and for each pair, he will also provide a subjective note related to the images (maybe what was most important to him about that lake or algae study, or a memory tied to that place). Lastly, he will provide a simplified representation of relevant data from that lake. I will then use ink to interpret, layer, and interweave these four components. I’m looking forward seeing the selected source materials and getting started on these experimental drawings. Tali This past week I have been working towards finishing the last piece that I will weave as a Tulsa Artist Fellow, before packing up my studio and moving at the end of December. Last Sunset Over the Arkansas is made from linen dyed with Osage orange and cochineal (plant and insect derived dyes respectively) and petrochemical-derived fishing line. Two separately woven panels will each shift from shades of green-gold to golden-yellow to coral and magenta, interpretations of 124 years of annual average temperature for Oklahoma. Each panel is loosely woven and semi-transparent, one hung in front of the other, so that no matter what side of the work you stand on, you will see both panels and how the colors interact with each other. The title of the piece refers to the Arkansas river which runs through Tulsa, and to Oklahoma’s expansive, dramatic sky. Both the river and the sky have influenced choices of color and form. The Arkansas is extremely polluted from the dumping of waste by refineries. When I first moved to Oklahoma at the beginning of 2017, the river was a trickle of grey-brown. But in May of this year it roared through Tulsa, overflowing its banks and swallowing up houses in the surrounding region, a result of the month’s unusually severe storm season—one local manifestation of global climate chaos. The flooding even uncovered a landfill that had been closed and out of use for 50 years, strewing huge quantities of plastic trash through a nature preserve. Tulsa’s sunrises and sunsets, in the meantime, are made increasingly stunning because (at least in part) of the pollution from local oil refineries. The work is a personal goodbye to a place I’ve called home for three years and also a goodbye that alludes to something larger—the changes and losses we face due to climate change. I am sharing this work in progress here because I realize that it is also influenced by the conversations I have been having with Oscar over the last two months and the images we have been looking at together, for example: the relationships between what is happening within an individual water body and what is happening around it; water separating into layers; fishing and fisherman as holding certain kinds of knowledge about the lake; the silica skeletons of dead algae falling to the bottom of a lake and becoming part of the buildup of sediment and the stories found in each sediment layer; images of diatoms and lake surfaces… Tali Last week, Oscar wrote about lakes as layered and that below the water, mineral and organic particles (including the silica structures of dead diatoms) are deposited on the lake bottom, building up sedimented layers. Each layer contains numerous indicators of change including pollen, charcoal, algae remains, among others. “These sediment layers are used to understand past changes in atmospheric, terrestrial, and aquatic changes. Lake sediments keep record of how lakes were born, how they evolved; they keep record of changes in the atmosphere, and forest fires; they tell us about human settlement, colonization, forestry and agricultural practices.” When we spoke about this later, Oscar pointed out that scientists usually only study one tiny aspect of what could be learned from any one layer of sediment. Some will look at pollen, some will look at carbon, etc. No scientist looks at the whole of a layer. No scientist would have the tools or time to read the full story any one layer of sediment has to tell. It isn’t practical or possible. Piecing together the story would need to be done by someone else. Everyone brings their own perspective and their own tools, which then shapes what one learns from the sediment. The knowledges/frameworks/expertise/cultural biases/experiences/political and social structures/worldviews we bring, determine, at least in part, what we see and what we learn. Or, as Donna Haraway puts it in phrases scattered throughout her recent book Staying With the Trouble: Making Kin in the Chthulucene: “It matters what thoughts think thoughts, it matters what knowledges know knowledges, it matters what stories tell stories, it matters which concepts think concepts.” The questions we ask of something shapes the answer we receive from it—this is certainly one of the benefits of cross disciplinary collaboration and dialogue. Coming from different disciplines, while Oscar and I have many over lapping interests, we often frame questions differently or focus in on different questions about the same thing, making for wide-ranging conversations that, I think, are expanding both of our perspectives.
Tali
I have been thinking that drawing might be a good way to incorporate the varied layers and interconnecting systems and scales and lifeforms Oscar and I have been discussing. So today, I am sharing a few past drawings that I am thinking of as references. To me, these are a combination of landscapes, maps, weavings (with ink on paper), and journals. They evoke the flexibility of cloth and build on the mathematical patterning of weaving while also undermining the logic of weaving. Rules are created and broken. Systems are set in place and changed. I started this first set of drawings while listening to the news of the hurricanes, floods, and fires August - October 2017.
These drawings each record my experience of moving through a specific place and time.
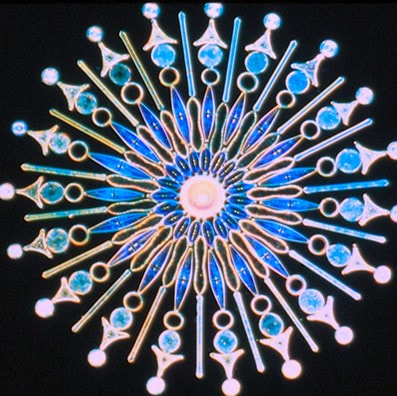
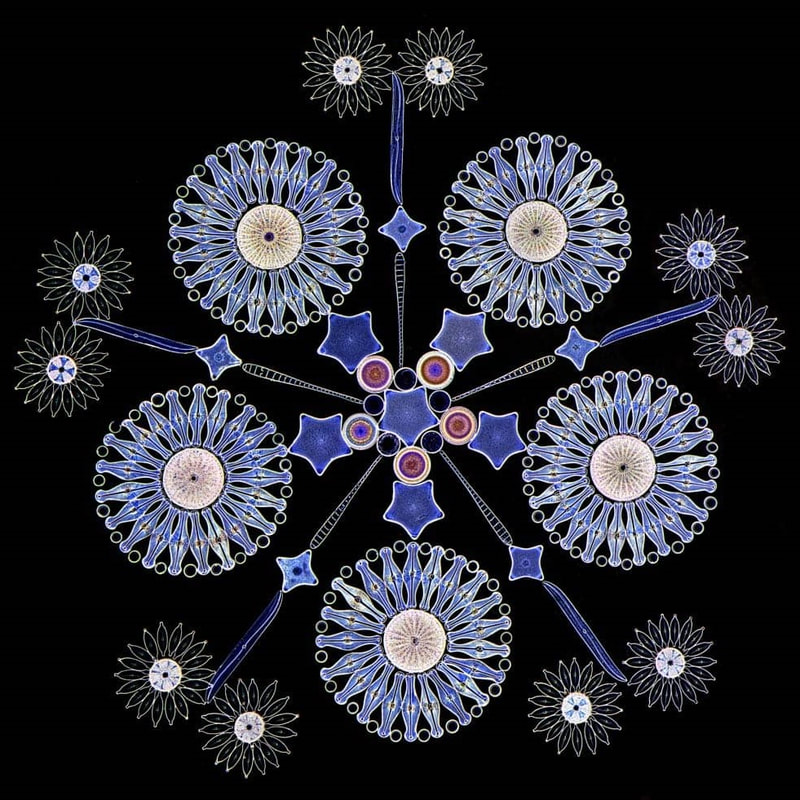
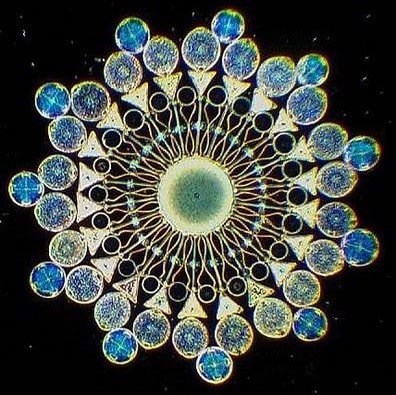
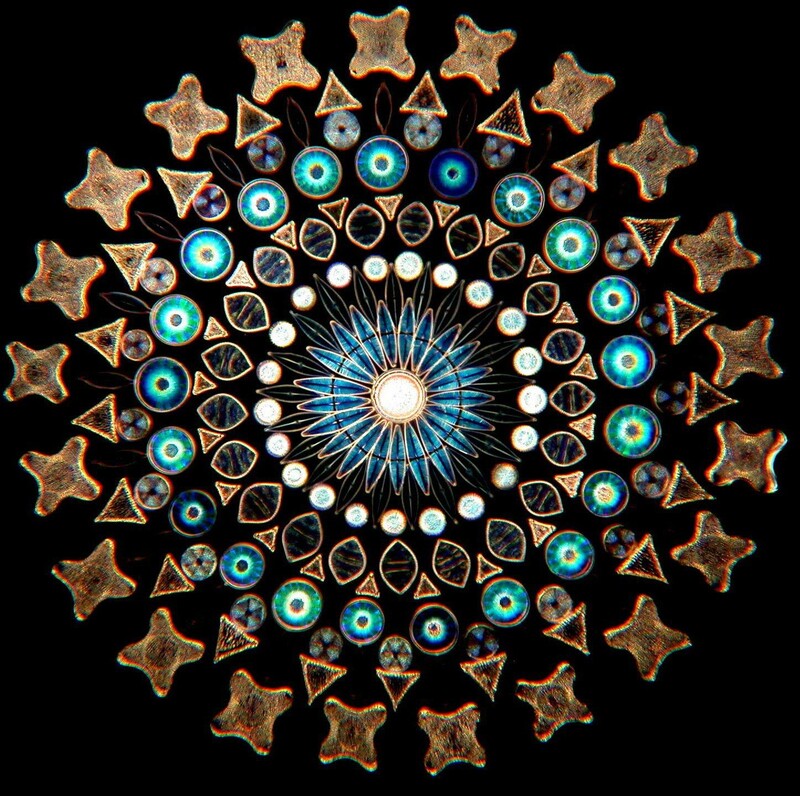
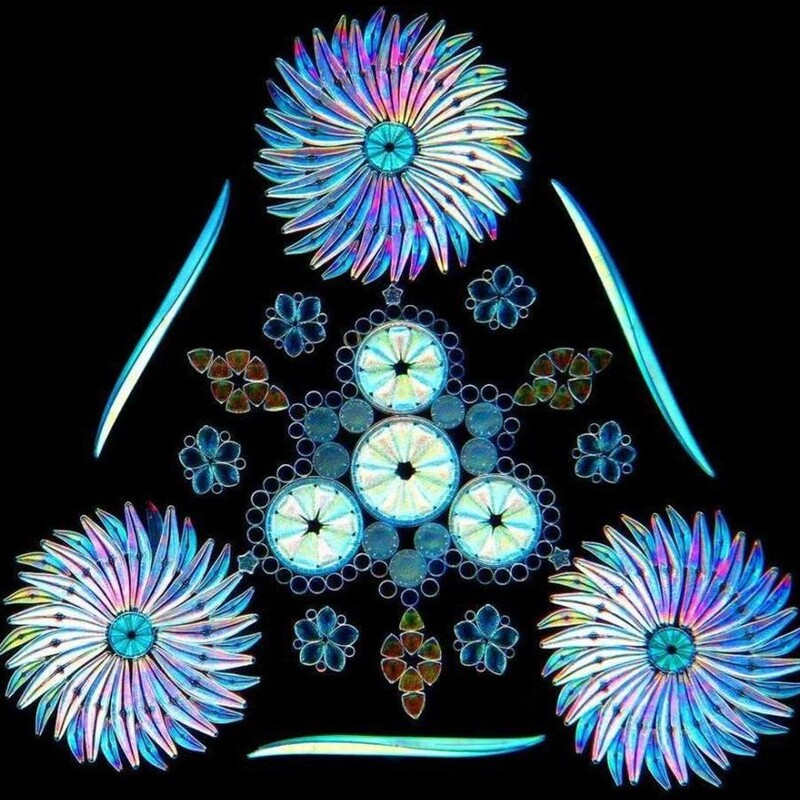
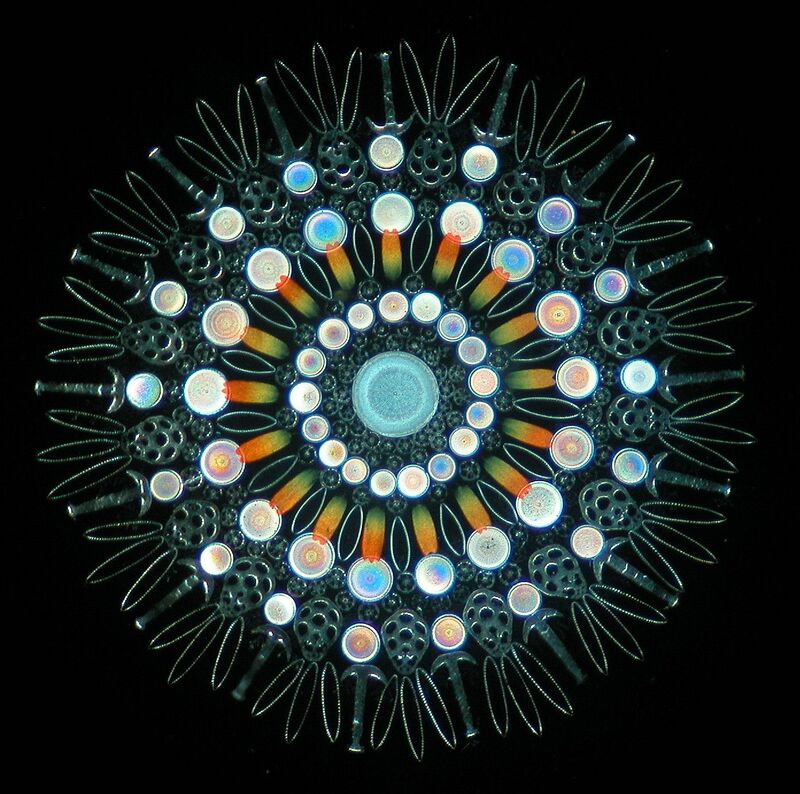
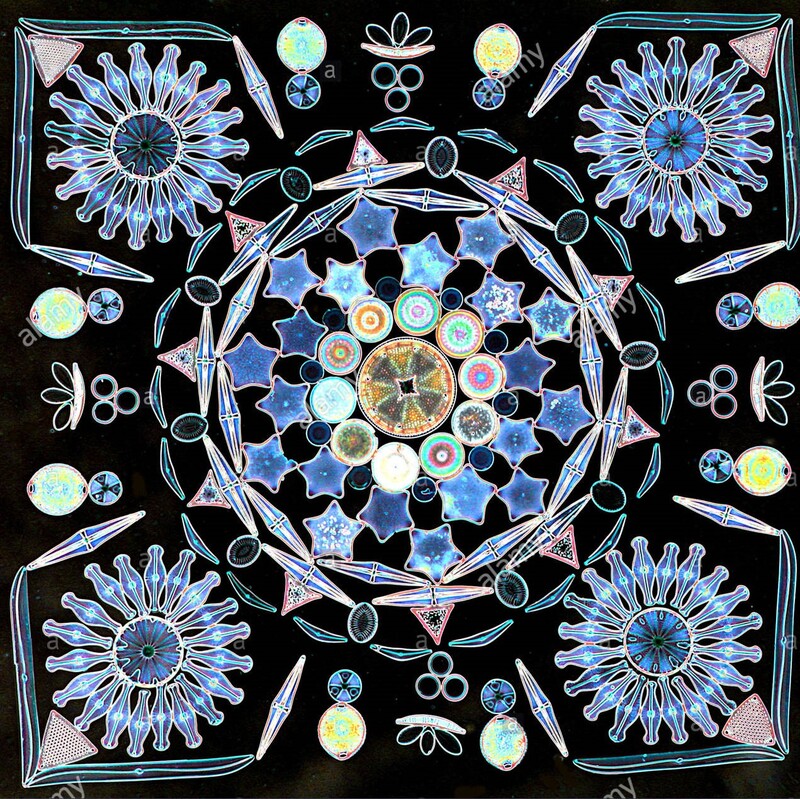
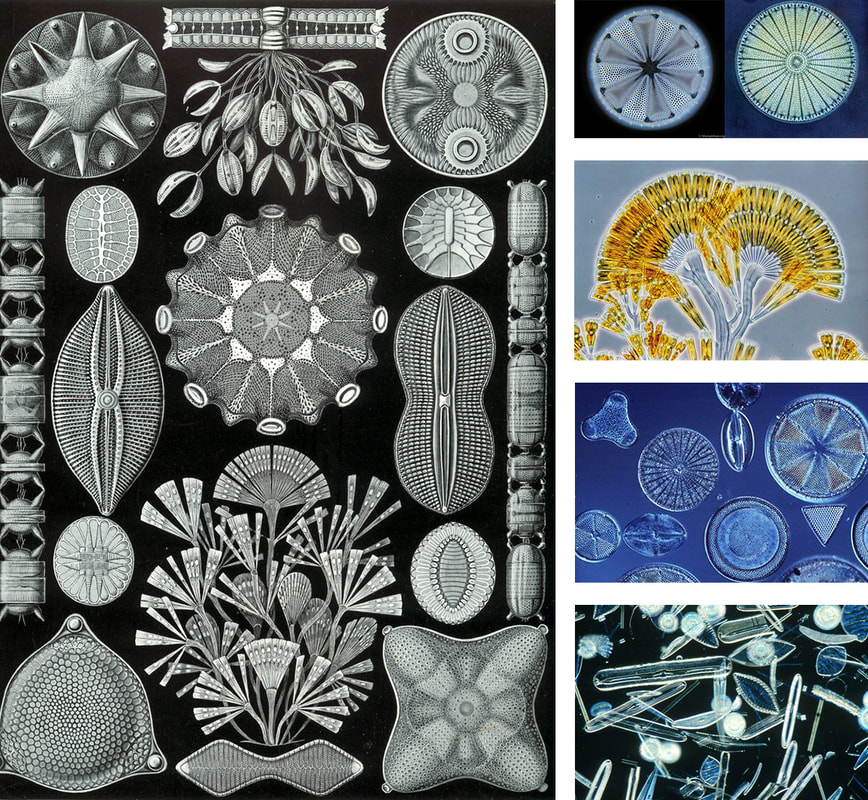
At age 16, Klaus Kemp came across a Victorian diatom arrangement and quickly became fascinated by these algae and the compositions created by these artists. Diatoms are algae (and therefore they grow their biomass from inorganic compounds and light) present in freshwater and marine environments. Diatoms are as diverse as beautiful (as Tali mentioned in her post last week), with some species living in open waters and other growing on sediments, rocks, and plant surfaces, some species forming colonies while others staying as isolated single cells. The most striking characteristic of these algae is their silica valves (like glass shells), the shape, size, and ornamentation of which are characteristic of each species (or group) and used for their identification. Each diatom species presents adaptations to live under specific nutrient, light, pH, and oxygen conditions, and the presence (or absence) of diatom species are often studied to track changes in aquatic environmental conditions.
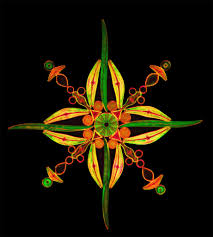
Klaus’ art often depicts diatoms in kaleidoscopic arrangements, carefully placing each cell in a pattern that emphasizes the diversity and beauty of these algae. These arrangements are almost “overwhelming. The variety and intricacy of shapes, patterns and repetitions evoke a profound sense of awe”. But there are more diatom arrangements than those made by Klaus. When diatoms die, they fall to the bottom of lakes and oceans, and since their shells are made of silica, they do not decompose, and remain as some sort of fossils, as an imprint of the conditions of past times. These fortuitous arrangements are equally beautiful in their own way, as they tell the story of lakes and oceans, and their surrounding environments.
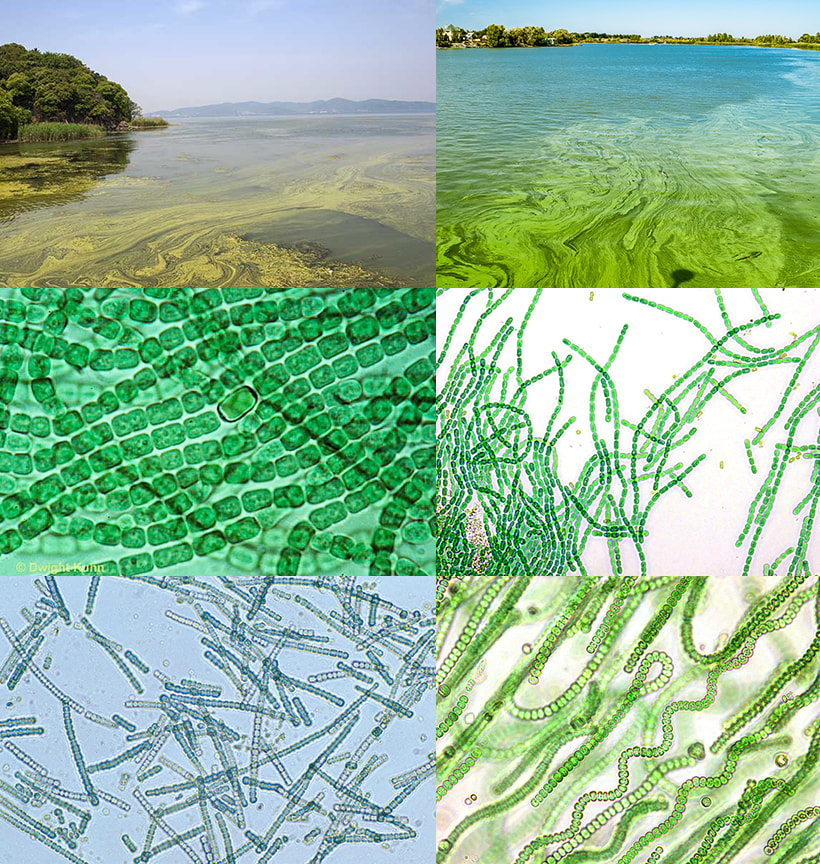
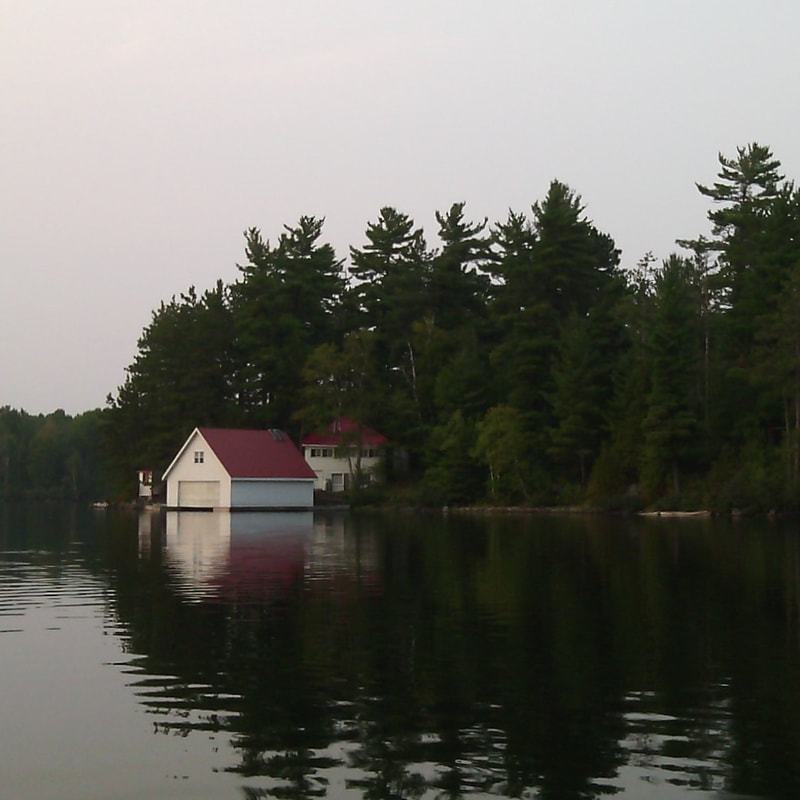
Watching how Klaus works through the microscope, carefully picking and placing diatoms on a slide I am reminded of the work of scientists studying diatom records in lake and ocean sediments. I imagine Tali’s process being very similar, inspecting the data, carefully arranging it, and creating new narratives that evoke a profound sense of awe (as Klaus describes it). During our conversations, we continue sharing our techniques and the knowledge we gain from them, and while more similarities in our processes continue to arise, I become even more interested in all those parts that our work does not necessarily have in common, as these can be the trigger of new perspectives to explore and explain environmental and social change. Tali I am still in the collecting/observing/absorbing phase of this project. Last week, Oscar walked me through the different types of algae found in the lakes he and his team study, explaining how the prevalence of each algae changes as lakes go through the process of browning. I was as interested in how we described the forms and colors of the algae as I was in their relationship to climate change, health, and lake browning. Oscar described diatoms as the most beautiful algae in the world. Indeed, a search online returns hundreds of beautiful images, drawings, and artworks inspired by these algae. They are “good” algae because they are high in fatty acids, making them important to the food chain and human health. These beautiful, important, microscopic creatures also happen to be particularly vulnerable to warming and ocean acidification. While, he reminded me, a diversity of algae in a lake is better for the food chain, and any one type of algae growing too much can be a problem, in browning, one tends to see a shift from diatoms in the healthiest lakes to cyanobacteria and then chrysophytes in browner lakes. Chrysophytes are also known as golden algae and look a bit like branches under the microscope. Cyanobacteria, also known as blue-green algae and described as resembling pearl necklaces, produce powerful toxins. As water warms due to climate change, these algae increase creating blooms on the surface of water which are harmful to human and non-human animals. While I am still exploring and absorbing new information, I have to remind myself that developing a new project and figuring out how to integrate webs of information can take time. I am grateful for how generous Oscar is with his knowledge and am enjoying this process of learning about issues I have been interested in for years though a new lens. Oscar The reflection of trees and clouds on the surface of a lake is just a reflection of what lakes are, and how lakes function. Atmospheric changes (like increasing temperatures, nitrogen deposition, or acid rain) have the capacity to alter functioning and life on terrestrial and aquatic ecosystems; and, in turn, changes in terrestrial ecosystems (for example, changing land cover, forest fires, agricultural and industrial practices), subsequently affect aquatic systems. The connectivity of lakes to surrounding systems makes them respond rapidly to any alterations in the landscape. This vulnerability translates into lakes functioning as early-warning signals of large-scale changes, or sentinels of change. Lakes are layered, and are definitely more than what we can see on their surface. In temperate latitudes, lakes typically respond to seasonal temperature changes by stratifying during the summer months. This stratification process results into two water layers: an upper warm and illuminated water layer where most organisms live and photosynthesis tends to dominate, and a deeper cool and dark water layer where bacterial degradation of dying biomass dominates. By monitoring the physical, chemical, and biological conditions of these layers we can understand how lakes are functioning, and how they are reacting to atmospheric and terrestrial changes. Lakes are more than the water and organisms living in them. Below the water column, mineral and organic particles are deposited on the lake bottom conforming a series of sediment layers where the upper layers contain the most recent sediments and they get ‘older’ with depth. Among these particles, we find pollen, charcoal, remnants of algae, crustaceans, and mollusks (among many other indicators of change). These sediment layers are used to understand past changes in atmospheric, terrestrial, and aquatic changes (the same way that the study of air trapped in bubbles in ice cores tell us about past atmospheric conditions - which Tali mentioned in her post a couple of weeks ago). Lake sediments keep record of how lakes were born, how they evolved; they keep record of changes in the atmosphere, and forest fires; they tell us about human settlement, colonization, forestry and agricultural practices. The combination of landscape characteristics, water quality, and sediment records can tell us about the historical evolution and current state of nature. In our last conversation, Tali and I talked about how we can integrate information in all these scales and the different approaches we can take to combining this information. The same way that scientists repurposed the data in ice records collected for centuries by the priests in Lake Suwa, Tali noted patterns in the different types of data recorded from my study lakes, giving new (?) meanings to this information (or, at least, highlighting different aspects). The depth maps of lakes (some of them hand drawn decades ago) resembled the shapes of the lake algae in pictures taken using microscopy techniques; which could also be compared to the watershed maps generated through geographic information systems using landscape elevation maps. We went through these different types of information while talking about photos I took of our lakes and how I remembered them, and how these could be integrated with the data in a single picture; the same way than a lake integrates information in its landscape, water, and sediments.
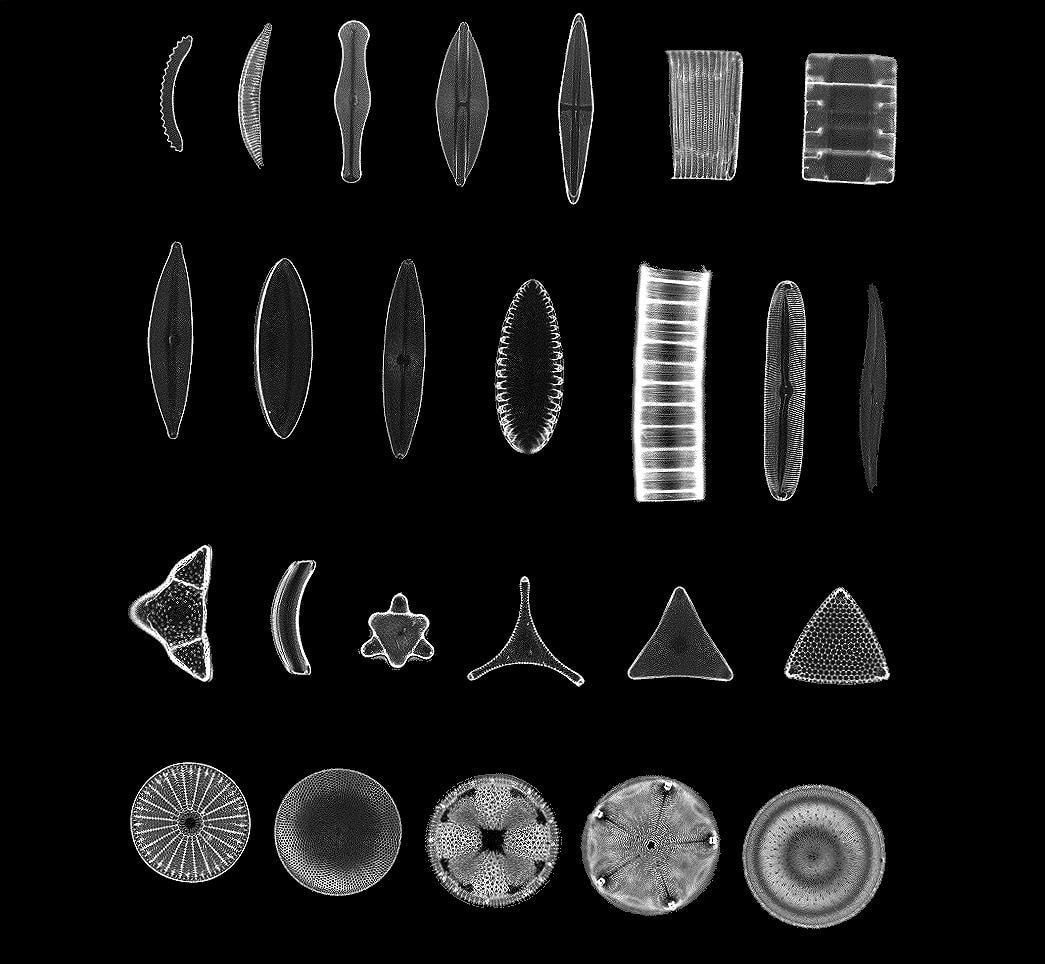
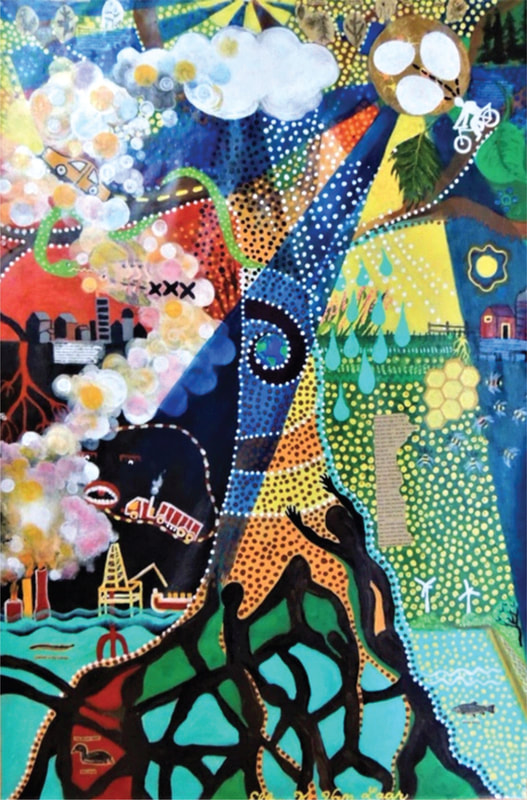
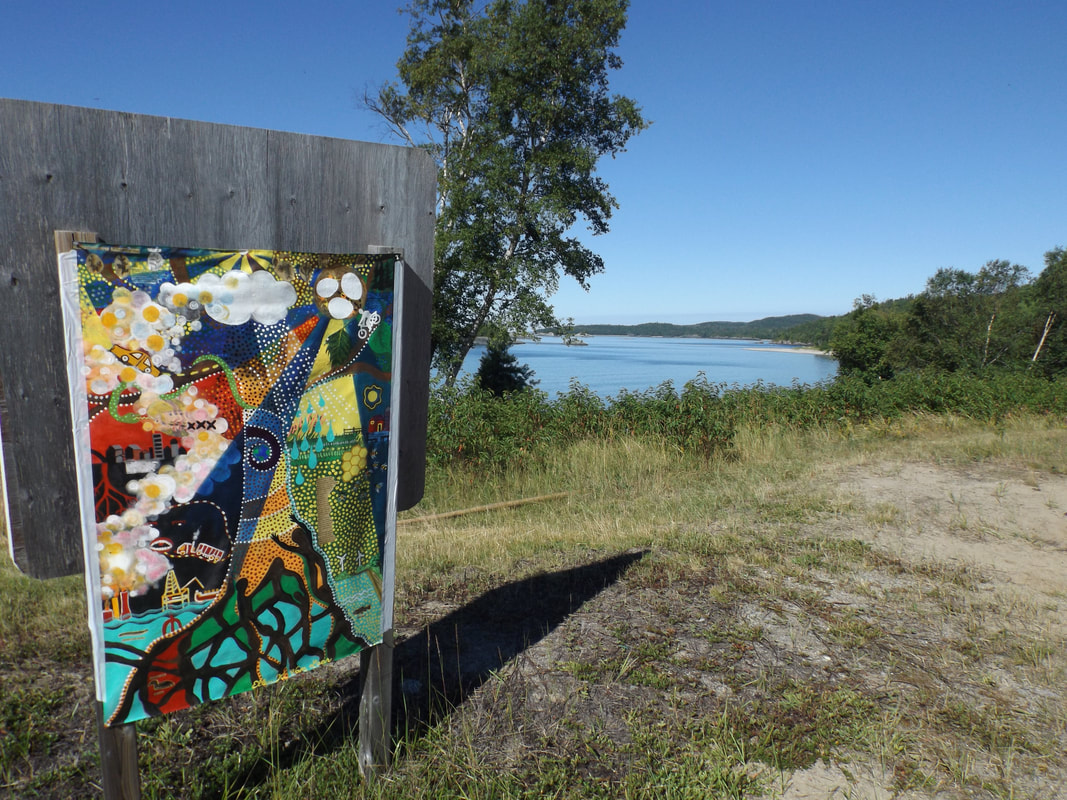
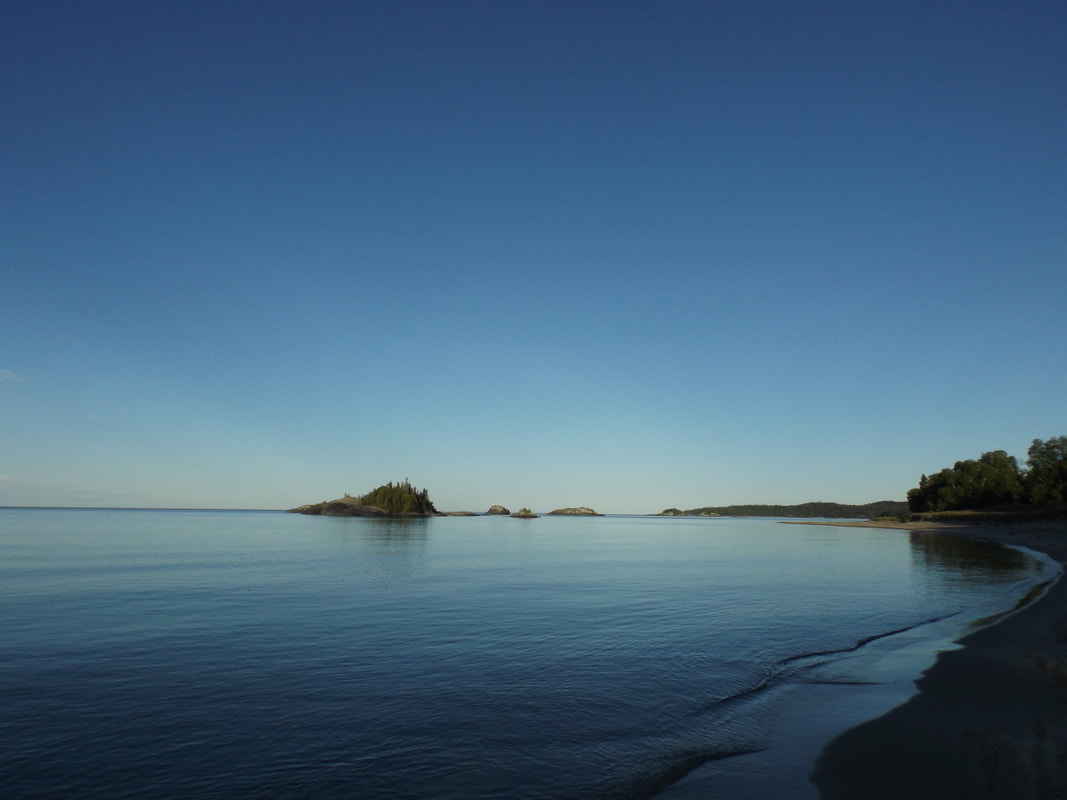
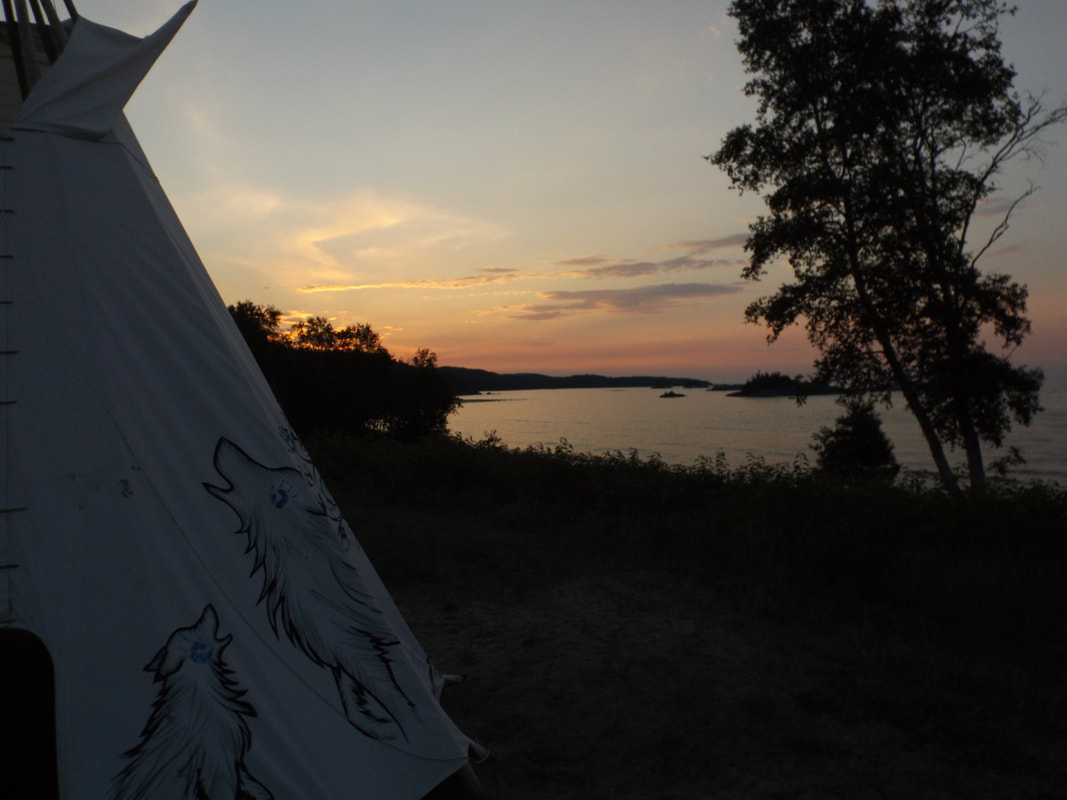
In the past, Tali noticed commonalities in our work, and through our conversations, we can keep adding more items to this list of commonalities or, (how I like to look at them) guidelines or considerations to SciArt collaborations to explore and explain change: (1) our work is shaped by constraints, and because (2) it’s all about relationships, (3) our techniques should allow for the integration of many scales, including (4) adding dimensionality to integrate facts and perceptions (which generates empathy relationships between authors and audience to amplify the message). I am really enjoying this learning experience and hoping that we keep on adding more items to this list. Tali An important part of my process when starting a new project is sifting through visual information. In my last conversation with Oscar, I asked what imagery he had from his time researching lake browning. In response, he shared dozens of photos of algae under a microscope, maps of the lakes and photos taken from the boat during field research. In making my way through these images, I feel a sense of responsibility as I start to work with/interpret/manipulate someone else’s fieldwork. At the same time, I know that in order to figure out the direction of a project, the first thing I need to do is play, letting go of a specific goal and constraints of what I “should” do and learning from process and what I feel drawn to. What I was first drawn to in sifting through images was the visual relationships between the slide images of algae under a microscope and the topographical maps of the various lakes that served as field sites. From a slide image of many algae forming a mass, the individual algae are separated out so that one can see how many of each type of algae are in a sample. After spending time looking through the algae slides, I turned to the lake maps, thinking about the different scales at which we study/come to understand the world, the relationships between those scales, the possibilities as well as the limitations of what we can know by looking at a discretely defined organism or place. The algae, separated out in slide images are a way for scientists to study certain phenomena, However, they are not found in the lake as clearly defined organisms, but rather as groupings/ as beings in proximity/in relation. The maps of lakes, drawn floating in space, are similarly presented as discrete places of study. Though again, of course, a landscape ecologist understands that these are not at all isolated, and that it is the lake’s connections to what is around it that is at the heart of what is being studied. On impulse, I rearranged some of the topographical maps of lakes into a form resembling the separated algae slides. In doing this, I realize I am asking a familiar question. Both the maps and the slides of separate organisms/lakes floating in space are a way for humans to easily see/study something. Understanding that there is value to this kind of representation, I also want to know, what are we missing in these singular representations and is there the potential to reincorporate or point to complex relationships without muddying a representation to the point of uselessness? Oscar The boreal zone contains 309 million ha of forests as well as 71 million ha of water bodies. This landscape provides many ecosystem services (all the benefits we receive from nature, like water, food, energy, climate regulation, pollination, spiritual values…) that could be at risk due to global natural and political changes. The future of the boreal zone will be shaped by our (increasing or decreasing) reliance on carbon energy sources and the (greater or lower) society’s capacity to adapt to change. This was the premise of the Boreal 2050 project, where government officials and scientists, representatives from Indigenous communities, academics, economists, and artist(s) collaborated to create narratives for four future scenarios for the Canadian Boreal Zone to inform management and policy makers. In the painting, Ellen Van Laar represented the four future scenarios that could shape the management of the Canadian Boreal Zone based on the discussions held in the context of the project. In last weeks post I shared some of our ideas on the role of a narrator in arts and sciences, and how incorporating the motivations and history of a narrator (/author) could elevate the work’s message. If this is true, then we could argue that the synergies between artists and scientists could magnify its impact even more. As I think about these synergies (from a very personal, most-likely biased, potentially simplistic, and probably wrong perspective) and some of my experience in the Boreal 2050 project, I realize that I have experienced some of the benefits of SciArt collaborations. These collaborations have the potential to integrate many (and) diverse perspectives, challenging the conventions of individual disciplines, and helping to decontextualize the work from its original boundaries. Consequently, these collaborations expand the range of audiences that will read the information in the projects’ outputs, creating common spaces between different communities and generating broader discussion. Ellen then invited us to join her in the Michipicoten First Nation Pow Wow during the summer of 2017 (right after the Boreal 2050 discussions ended and the outputs were shaping as Ellen’s painting and a series of manuscripts). During the whole weekend, Ellen’s work hanged at the shore of the largest freshwater lake in the world, Lake Superior, and at the southern edge of the Boreal forest. We made friends with the Fire Keeper and learned from elders and younger generations about the change in the region, the introduction of forestry companies, the declines in fishing and hunting rates, the loss of water quality, the expansion of the energy network, changes in demographics, the new generations... In this little corner of the world, the message of the Boreal 2050 project transcended the academic boundaries that constrained scientific papers and conference presentations; it generated discussion and, probably most importantly, it resulted in knowledge exchange. As we explore the SciArt collaboration, I am hoping to learn more about how differently (or not) different audiences react to Tali’s work (already combining art and science) compared to my (collaborative) research work, and discuss whether SciArt collaborative work could actually break boundaries and reach greater audiences and cause greater impact.
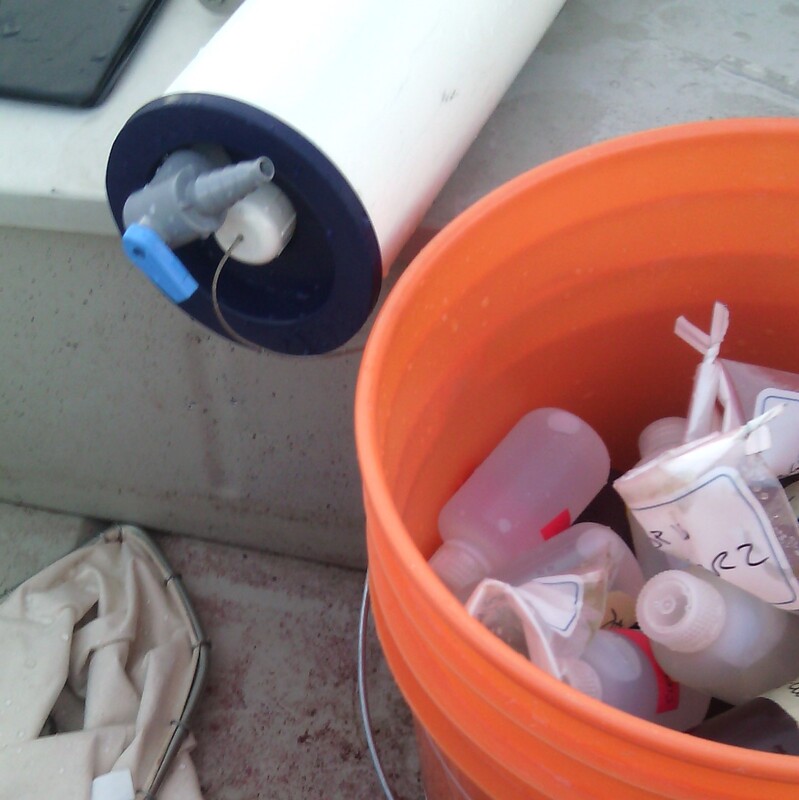
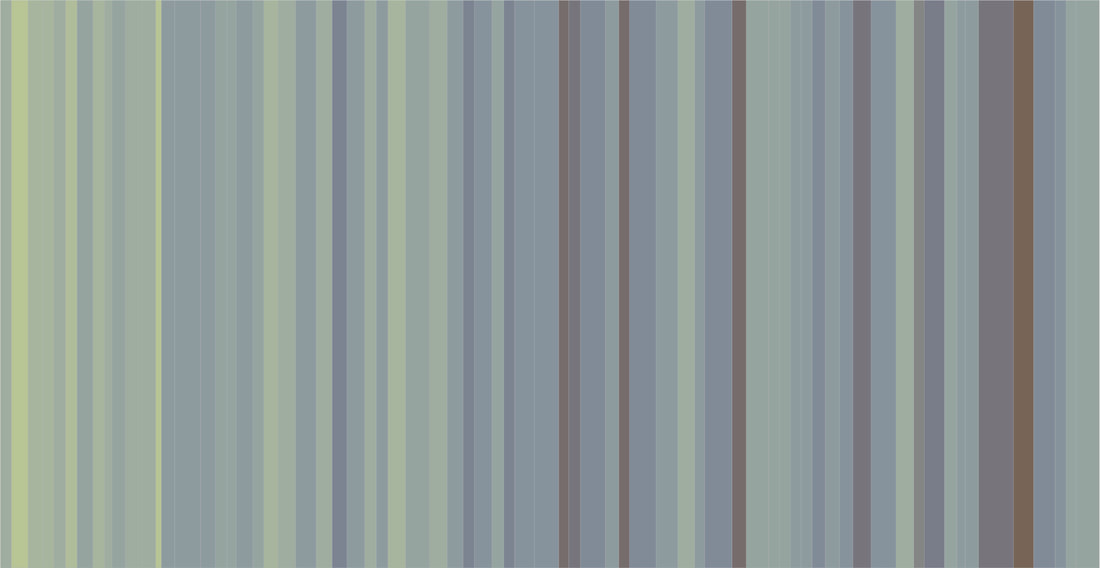
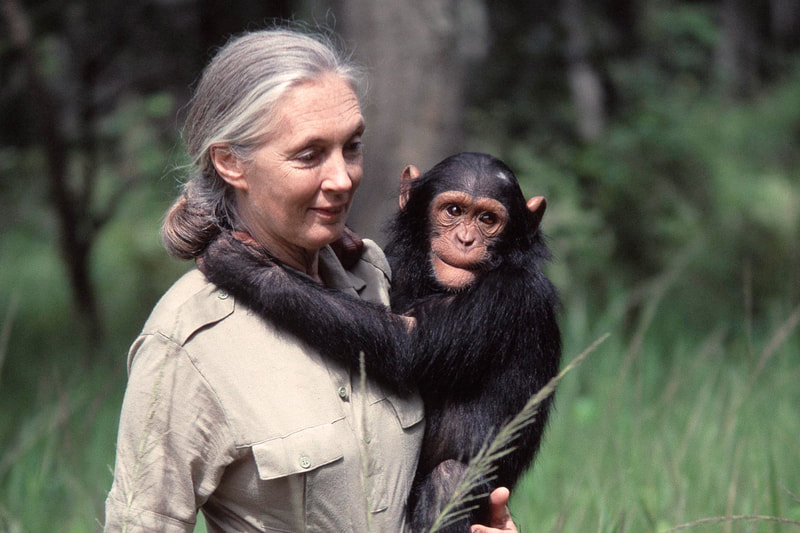
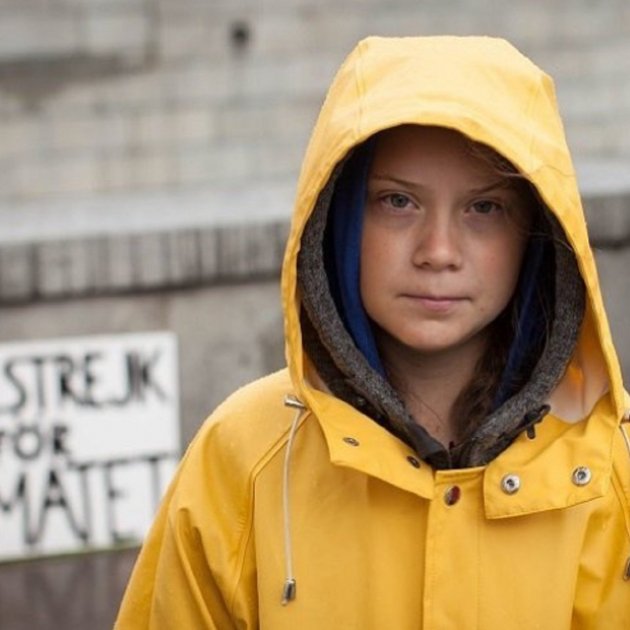
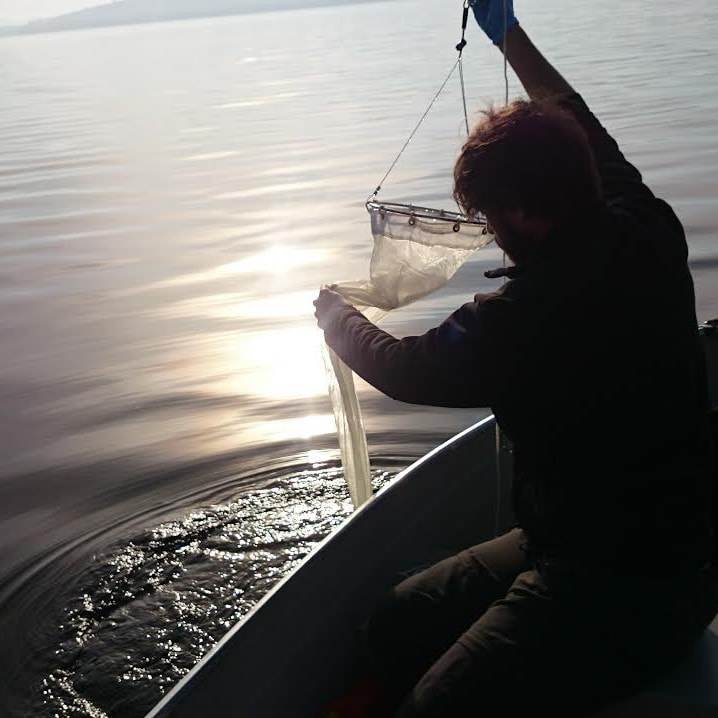
Oscar In exhibitions, artwork is often contextualized within the artist’s life. Understanding the personal motivations of the artist is often necessary to understand their work. However, we rarely know anything about the scientists behind a study. We understand the motivations of the project, but not their personal motivations, or what they went through at different stages of the project. This is because we can understand the results and conclusions of a scientific study without necessarily learning about the people behind the numbers. This is something that Julia Buntaine Hoel (SciArt Initiative’s Founding Executive Director, who has been guiding Tali and I these weeks) mentioned after our last conversation; and it is something I have been thinking about since then. Anyone with my same interest for understanding how vulnerable lakes are to changing climate could have produced a similar research work. But even if their results were comparable to mines and the conclusions of their studies were the same, we all have our preferences and styles, and that is also imprinted in scientific studies. My interest in science communication grows as I learn from this collaboration. In the figure above (inspired by Tali’s work and the Warming stripes), each stripe represents the quantity, quality, and source of organic compounds of each one of the 71 lakes in central Ontario that conform my study. However, Tali’s work does not simply represent data. Through Tali’s creation process, data is organized, and natural patterns in the data bend and merge with her experiences and the decisions she makes as colors and shapes appear in the preliminary sketches and the computer simulations, elevated by the format of the artwork, the materials, and the techniques used in the process; by the number of pieces in an exhibition, and their arrangement to narrate the story behind them. My figure is missing more dimensions: my own experience (and those who I work with) while in the field, the quietness of the boat slowly drifting while we collect the samples, the changes in weather that inevitably changed our mood, an excited text message from those in the lab who are analyzing the samples from the day before as we drive to the next lake, the feeling of cool water on our hands on a hot August day, and the temporary relief of our cold hands in the lake water (warmer than the air) on a windy day in early October; the people who approach us while we launch our boat to ask about our work, and the people we approach when we want to learn more about them and the lake they live on; that gentleman who invited us into his property to access the lake while his grandsons where camping at the lake shore, and that group of three couples who waved at us hoping that our small aluminum boat could tow their ginormous vessel back to their cottage... Is science more powerful when there is a narrator attached to it? What if we learned about the people behind the science, or the people who are interested in creating awareness? Is this key to release academic knowledge from University settings and incorporate it to traditional knowledge? Is this key to make a change? Change makers: Taraji P. Henson and Katherine Johnson (left), Jane Goodall (center), Greta Thunberg (right). A couple of weeks ago, Tali wrote about commonalities in our work. She concluded that our work is shaped by constraints, and that it is all about the relationships. I have been thinking about these as guidelines to SciArt collaborations (from our personal experience). If these really are guidelines (or considerations) to collaborative work, then we should add a third point to the list: dimensionality. SciArt collaborations should also aim to integrate facts and perceptions (and all the nuances from these relationships) to boost the impact of the product and inspire change.
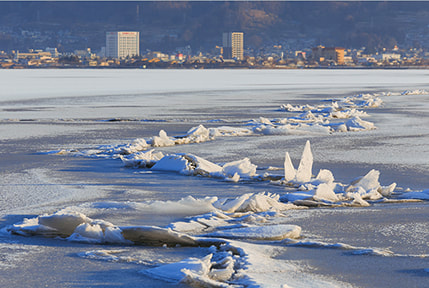
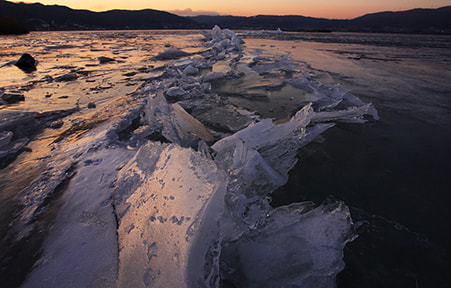
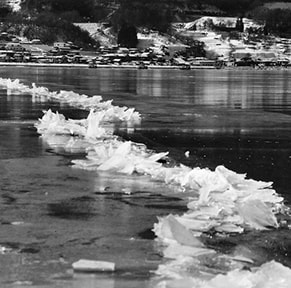
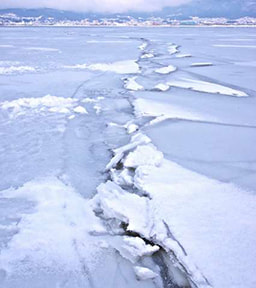
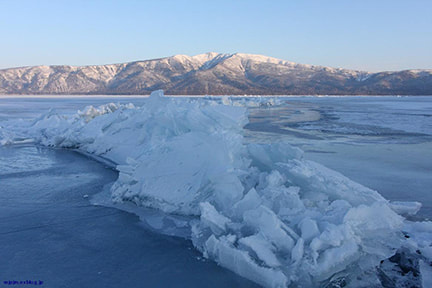
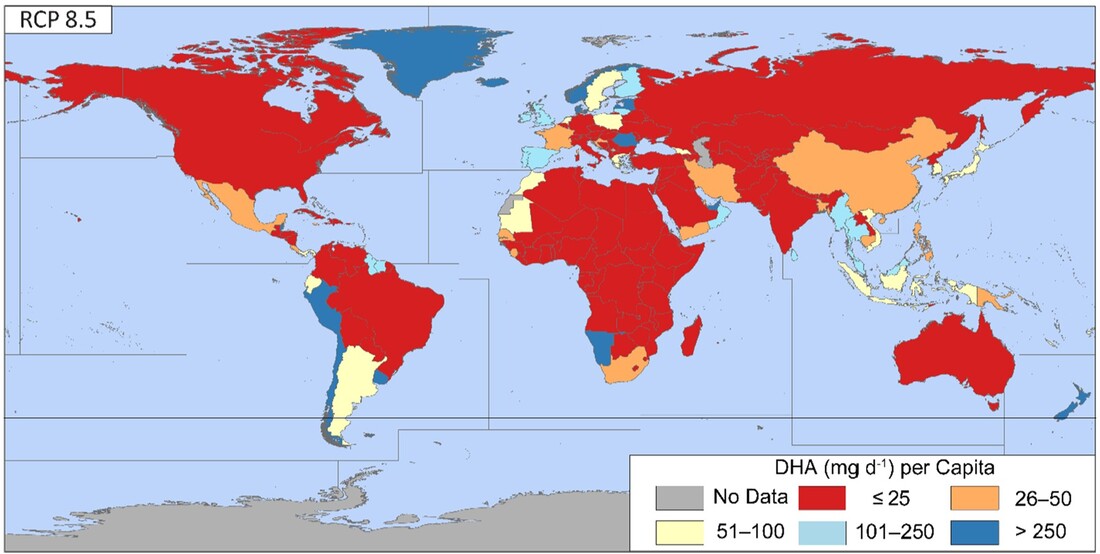
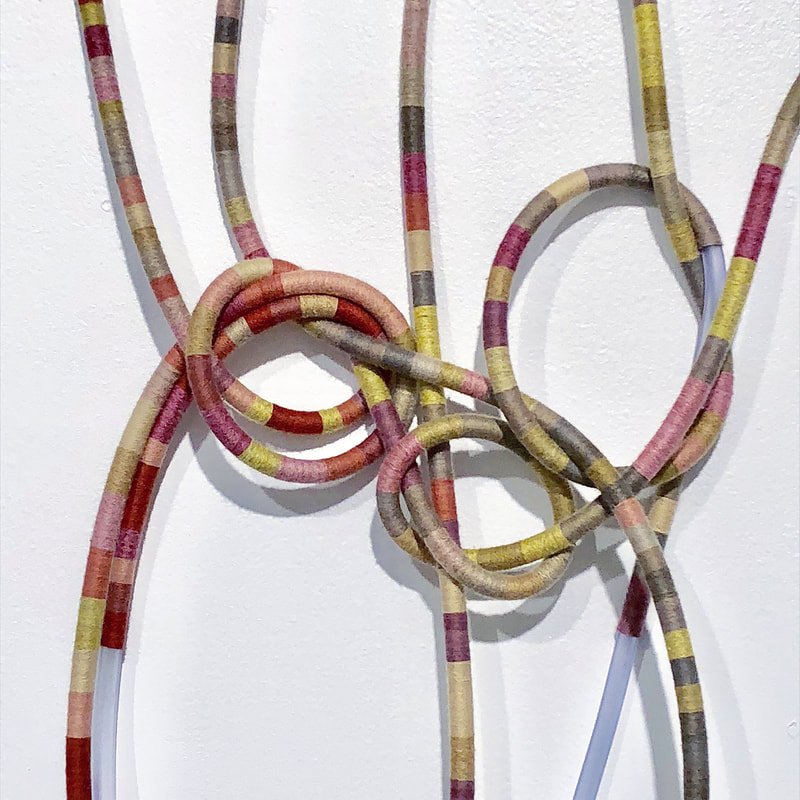
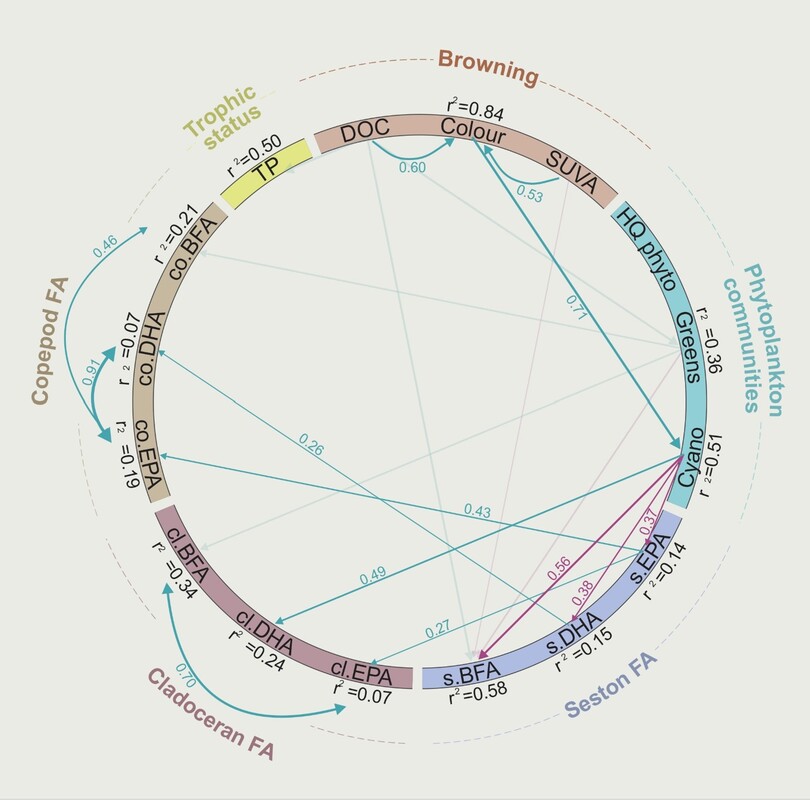
Tali In Oscar’s last post he mentioned how Japanese monks had been recording lake freeze for 700 years - a tangible example of the production of knowledge as a time- and labor-intensive process that is contributed to generation after generation, each generation dependent on the last. And also an example of how scientific knowledge may have unexpected origins. While what our generation of scientists sees is a record of climate change, the monks were not intentionally leaving behind a record for this purpose. They were instead recording the date omiwatari (a ridge of ice) forms as the time of year that gods crossed the lake, leaving behind footprints - knowledge that is the result of a spiritual/communal relationship to place. I listen to a lot of books while working in the studio, and as I browsed through photos of omiwatari through google image search, I was reminded of one of my favorite passages from the chapter, “The Blue of Time” in Robert Macfarlane’s Underland. I am sharing that passage with you here: “Ice has a memory. It remembers in detail and it remembers for a million years or more. Ice remembers forest fires and rising seas. Ice remembers the chemical composition of the air around the start of the last Ice Age, 110,000 years ago. It remembers how many days of sunshine fell upon it in a summer 50,000 years ago. It remembers the temperature in the clouds at a moment of snowfall early in the Holocene. It remembers the explosions of Tambora in 1815, Laki in 1783, Mount St Helens in 1482 and Kuwae in 1453. It remembers the smelting boom of the Romans, and it remembers the lethal quantities of lead that were present in petrol in the decades after the Second World War. It remembers and it tells - tells us that we live on a fickle planet, capable of swift shifts and rapid reversals. Ice has a memory and the colour of this memory is blue. High on the ice cap, snow falls and settles in soft layers known as firn. As the firn forms, air is trapped between snowflakes, and so too are dust and other particles. More snow falls, settling upon the existing layers of firn, starting to seal the air within them. More snow falls, and still more. The weight of snow begins to build up above the original layer, compressing it, changing the structure of the snow. The intricate geometries of the flakes begin to collapse. Under pressure, snow starts to sinter into ice. As ice crystals form, the trapped air gets squeezed together into tiny bubbles. This burial is a form of preservation. Each of those air bubbles is a museum, a silver reliquary in which is kept a record of the atmosphere at the time the snow first fell. Initially, the bubbles form as spheres. As the ice moves deeper down, and the pressure builds on it, those bubbles are squeezed into long rods or flattened discs or cursive loops. The colour of deep ice is blue, a blue unlike any other in the world - the blue of time. The blue of time is glimpsed in the depths of crevasses. The blue of time is glimpsed at the calving faces of glaciers, where bergs of 100,000-year-old ice surge to the surface of fjords from far below the water level. The blue of time is so beautiful that it pulls body and mind towards it. Ice is a recording medium and a storage medium. It collects and keeps data for millennia. Unlike our hard disks and terrabyte blocks, which are quickly updated or become outdated, ice has been consistent in its technology over millions of years. Once you know how to read its archive, it is legible almost as far back - as far down - as the ice goes. Trapped air bubbles preserve details of atmospheric composition. The isotopic content of water molecules in the snow records temperature. Impurities in the snow - sulphuric acid, hydrogen peroxide - indicate past volcanic eruptions, pollution levels, biomass burning, or the extent of sea ice and its proximity. Hydrogen peroxide levels show how much sunlight fell upon the snow. To imagine ice as a “medium” in this sense might also be to imagine it as a “medium” in the supernatural sense: a presence permitting communication with the dead and the buried, across gulfs of deep time, through which one might hear distant messages from the Pleistocene. Ice has an exceptional memory - but it also suffers from memory loss. The weight on 2,000-year-old ice can reach half a ton per square inch. The air in this ice has been so compressed that cores brought up by deep drilling will fracture and snap as the air expands. This is why glaciers sound like shooting ranges. This is why if you were to drop a piece of very old blue ice in a glass of water or whisky, it might shatter the glass. Deeper still – in ice aged between 8,000 and 12,000 years - the pressure becomes so great that air bubbles can no longer survive as vacancies within the structure of the ice. They vanish as visible forms, instead combining with the ice to form an ice-air mixture called clathrate. Clathrate is harder to read as a medium, and the messages it holds are fainter, more encrypted. In mile-deep ice, individual layers can only just be made out as “greyish ghostly bands... visible in the focused beam of a fibre-optic lamp”. And because ice flows - because it continues to flow even when under immense pressures - it distorts its record, its layers folding and sliding, such that sequence can be almost impossible to discern. At the deepest points of the Greenland and Antarctic ice cap, where the ice is miles deep and hundreds of thousands of years old, the weight is so great that it depresses the rock beneath it into the Earth’s crust. At that depth, the compressed ice acts like a blanket, trapping the geothermal heat emanating from the bedrock. That deepest ice absorbs some of that heat, and melts slowly into water. This is why there are freshwater lakes sunk miles below the Antarctic ice cap - 500 or more of these subglacial reservoirs, showing up as spectral dashed outlines on maps of the region, unexposed for millions of years, as alien as the ice-covered oceans thought to exist on Saturn’s moon, Enceladus. As a human mind might, late in life, struggle to remember its earliest moments - buried as they are beneath an accumulation of subsequent memories - so the oldest memory of ice is harder to retrieve, and more vulnerable to loss.” Oscar In a recent study, a group of scientists explore the rates production of omega-3 fatty acids (essential for humans - and all animals -, produced by algae, and making their way to our diet through fish) under different climate scenarios. Their findings suggest that increasing water temperature will reduce omega-3 production, limiting their availability to meet human needs globally (especially in African inland regions), and putting human health at risk. This study represents one of the many consequences of climate change for human health. Sometimes, causal relationships (like those depicted in this study) are obvious or easily identifiable (i.e., consuming healthy food reduces risk of health loss); however, in many cases, causality is represented by complex causal pathways (higher temperatures → less omega-3 availability → Increased risk of health loss), or even causal networks (temperature-driven changes can also lead to higher toxin production, and as a consequence, fish kills, food poisoning, economic loss…) In our last conversation, Tali and I focused (partially) on causal networks, and how we explore and explain relationships. In Tali’s Inextricably bound project; one way in which complex relationships are represented is using different materials. Synthetic tubing used for medical purposes is combined with natural thread and dyes to represent reliance on petroleum and consequences for climate but also for human health (more here). In my work, statistical analyses reveal interactions between different characteristics of water (nutrients, color), algae, and crustaceans, and their implications for (also) omega-3 production and availability. While our approaches are different, our work intersects conceptually. We can bring the study of causal interactions a step further. When we have a question (or formulate a hypothesis) that is answered through exploration of a dataset to generate an outcome (artwork or articles), we are expecting to cause a reaction on the audience. This could spark further interest, raise awareness, promote further research, and/or favour feedback, expanding this knowledge network, which starts on our interest on the topic, and grows with greater exposure. In this context, SciArt and The Bridge program function as facilitators or triggers of these reactions, keeping the knowledge causal network growing. More to come; stay tuned…
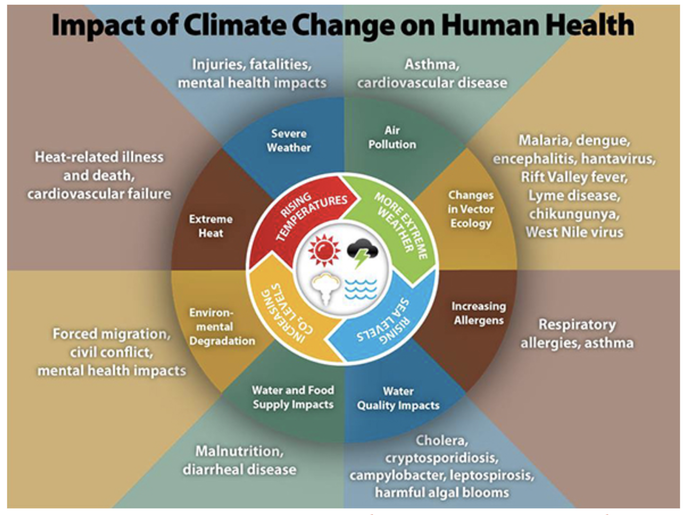
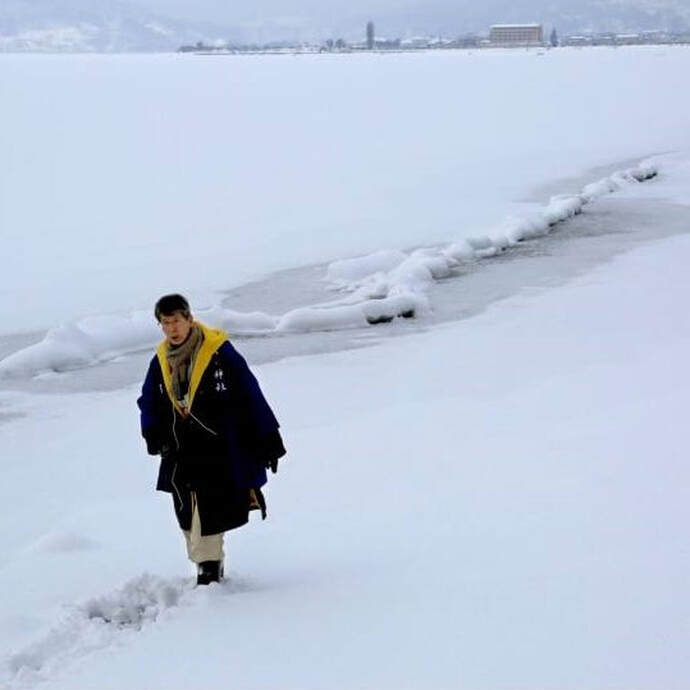
Tali Since Oscar and I had our first video call last week, I’ve been reflecting on some of the parallels in our thinking and processes. 1. The Work is Shaped by Constraints: When I first started incorporating climate data into my art practice, I felt self-conscious about how I let constraints shape some of my decisions. I originally chose this NOAA database, in part, because it was data I could easily access and understand without needing a scientist to interpret it or any specialized software to download it. My engagement with the data then led me to a still-unfolding series of questions that guides which dataset(s) I select for a given artwork—for example questions about how the data has been aggregated, what data is and is not included, relationships between places & datasets I learned in our conversation that the work of Oscar and his team of researchers is shaped, partially, by its own set of constraints. As one example, the specific lakes he studied were constrained geographically/physically since they need to be within a few days travel to the lab where the data could be analyzed. How can we make sure to work consciously within these constraints? How might we break through them? Or, how can we work with data in a way that points to what is missing and acknowledges the complex systems in which it was produced? 2. It’s All About Relationships: Oscar studies the browning of lakes. This browning has many causes linked to anthropogenic climate change: rising temperatures, acidification, changes in precipitation, etc. When he began this research, he quickly learned that in order to understand what is happening in the lakes, one has to understand what is happening outside of them. He spoke of this in the context of planetary health, that everything is connected and the health of one being is dependent on the wellbeing of an ecosystem. Even human health does not mean the absence of sickness, but rather is dependent on social and ecological health. Our discussion of interconnectedness and planetary health reminded me of some of the research I did while conceptualizing Bound. The Center for Disease Control and Prevention lists the ways climate change harms human health. Inversely, Health Care Without Harm demonstrates how the global health care sector contributes to climate change. This emphasis on relationships resonated deeply with me. Those in power within the enmeshed structures of patriarchal capitalism and settler colonialism attempt to obscure and sever many kinds of relationships. Seeking out and re-weaving relationships feels like some of the most important work one can do these days. As we move forward in this collaboration, I am excited to think through how our work can reveal relationships and the importance of those relationships (rather than individual datasets), while also finding ways to acknowledges and work beyond our usual constraints. Oscar Since 1443, the priests living at the shore of Lake Suwa (Japan) have been recording the date in which a ridge appears on the lake ice as the Shinto Gods walk over it. These dates describe the Gods’ behaviour, and mark the dates to celebrate their rituals. Years later, researchers found more stories in this data, and used it to track long-term climate-driven changes in lake freeze-thaw. Since 2014, we have been studying the connection between changes in lake color (lake browning) and algal blooms in northern latitudes. Data of lake physical and chemical characteristics, algae, and crustaceans helped us test our predictions regarding the causes and consequences of lake browning. Data serves to answer a question (what is called ‘deductive reasoning’, like the ice records of lake Suwa) or test a hypothesis (in ‘inductive reasoning’, like the datasets that research lake browning). However, “data doesn’t exist, data is a way that we, human beings, design to record our reality, but it's never the real thing, it's always the placeholder for something else” (Georgia Luppi, The Room of Change). Not only data is an incomplete or imperfect reality, but it is also very personal, “knowledge is socially situated and [that] the perspectives of oppressed groups including women, minorities and others are systematically excluded from “general” knowledge” (Catherine D'Ignazio, Civic Media).
Tali and I talked about how we gather, treat, explore, and represent data. I have been thinking about the limitations of our lake browning data since we had this conversation, which stories does it fails to tell? and which other narratives could our data tell (as is) if we looked at it from a different perspective? Could our lake browning data be explored in a different manner (the same way that scientists used the Lake Suwa data collected by priests) to generate new work? |

