|
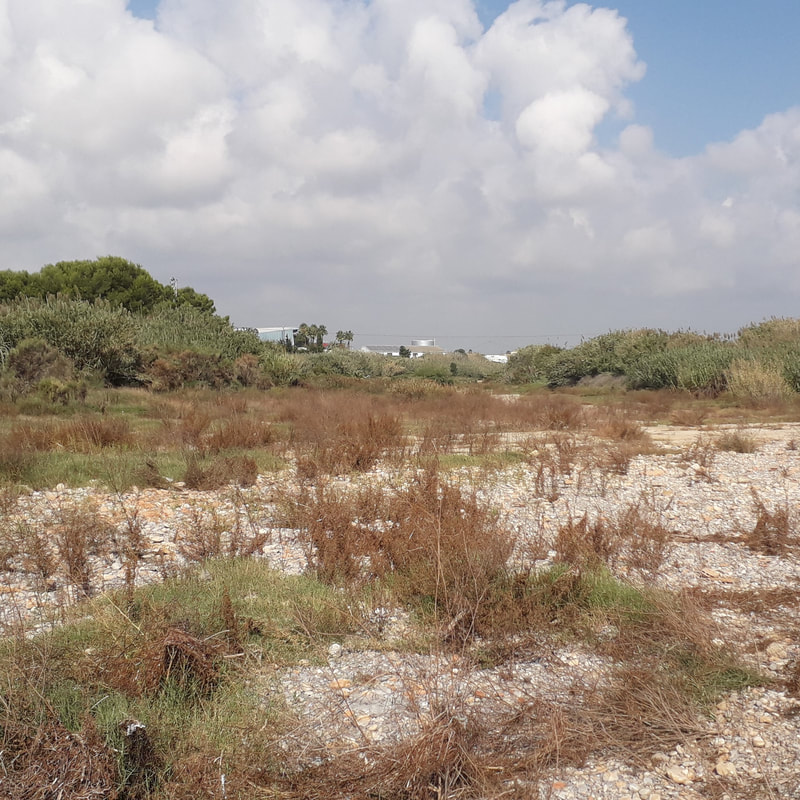
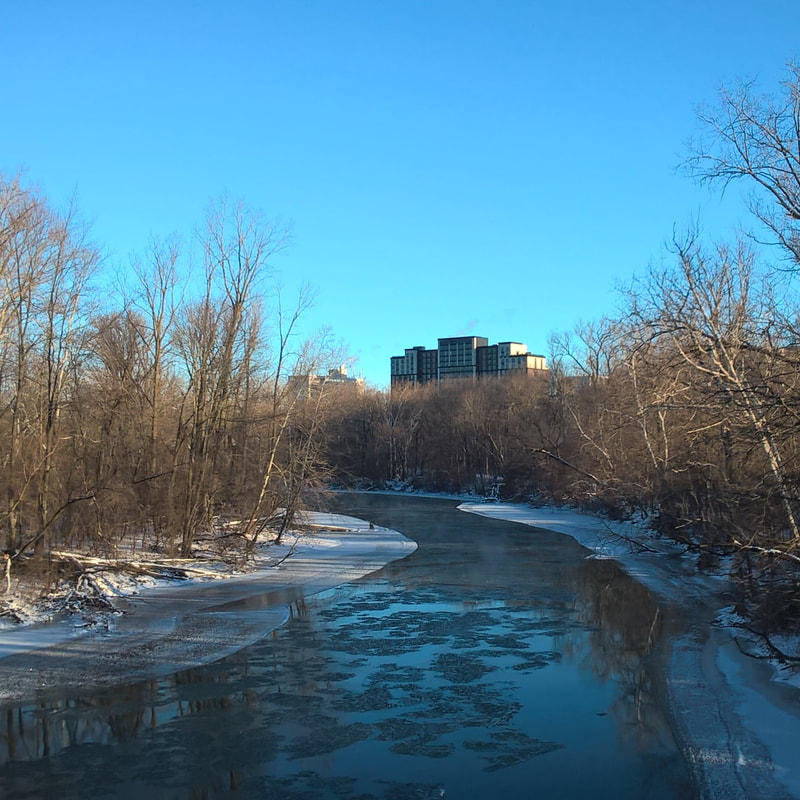
Tali My work with NOAA climate data has inspired an interested in the non-human origins of climate data and the embodied experience of scientists collecting that data in the field. I have been particularly struck when learning about sources of paleoclimate knowledge. Bee pollen, tree rings, ice cores and sediment are a few of the proxies we rely on to construct our understanding of climate change. These proxies are a vital source of knowledge. They are storytellers and geologic timepieces, not to mention beautiful. Bees are vital to sustenance. Forests are vital carbon sinks. But all of these proxies are also vulnerable bodies, subject to the violence of climate change, from bee colony collapse to forest fires and melting glaciers. Science, rather than a fully human endeavor, is a collaboration between the human and more-than-human world. Climate science is not only the abstraction of numbers and charts on a page and on a screen. It is organic and material. It is, in the right hands, a practice of close attention and a practice of care. I am looking forward to my first conversation with Oscar this week and learning more about his process of collecting and interpreting data. What is the experience of being in the field and moving through a landscape as a researcher? What is the feeling of collaborating with the non-human world? How does one know what to look for and where to look? Data visualizations are often used to convey information. But how might we convey the feeling behind that information? How can we encourage others not so much to understand the changes taking place in our world, but to truly, fully, sense them – to feel the care and love and attention and urgency - the reason that scientists spend the time that they do collecting and interpreting data in the first place? How do we connect people in the most deeply personal way so that they can see themselves and their own experiences within the science? How can we re-see relationships that are often obscured in contemporary life? Oscar Grasses, shrubs, and sparse pines of dark green grow on the coast of El Maestrat (eastern Spain) where flatlands alternate with mountain ranges of browns and greys. The intense fall rains and prolonged summer droughts create a landscape where riverbeds remain dry during most of the year and the Mediterranean Sea dominates the blue spectrum. Small towns and villages in the area rely on tourism, fishing, industry, and transform the land with agriculture practices that combine greens and citrus trees with almond and olive trees. At a similar latitude across the Atlantic, perennial forests of green (during spring and summer), yellow, and red (during fall) maples, birches, and oaks in the flatlands of the Great Lakes region in southern Ontario (Canada). These forests share the natural landscape with the numerous lakes, streams, and rivers fed by the spring snowmelt and fall rains. This area is also highly populated, with relatively large urban centers and intensive (corn!) agriculture. These distant landscapes (like all landscapes) are composed by physical, biological, and cultural elements that interact to construct the visual forms and colors and influence our lives in many ways. The Mediterranean landscapes taught me how to think, speak, and grow. The North-American landscapes taught me how nature works, and how humans interact with it. And while I am still learning (how to study) their functioning, the Bridge Residency opens a new perspective on these complex networks. After some years dissecting landscapes, I now collaborate with an expert on constructing landscapes. Tali uses data to construct woven landscapes that represent change. While some of our methodologies may overlap (selecting variables, organizing data, exploring changes), the decision-making process may be different (how is the data used? Is part of the data discarded? Why? How is the data represented?), and so are the techniques we use (instruments, materials…), and even how our work reflects who we are or our relationship with the audience.
0 Comments
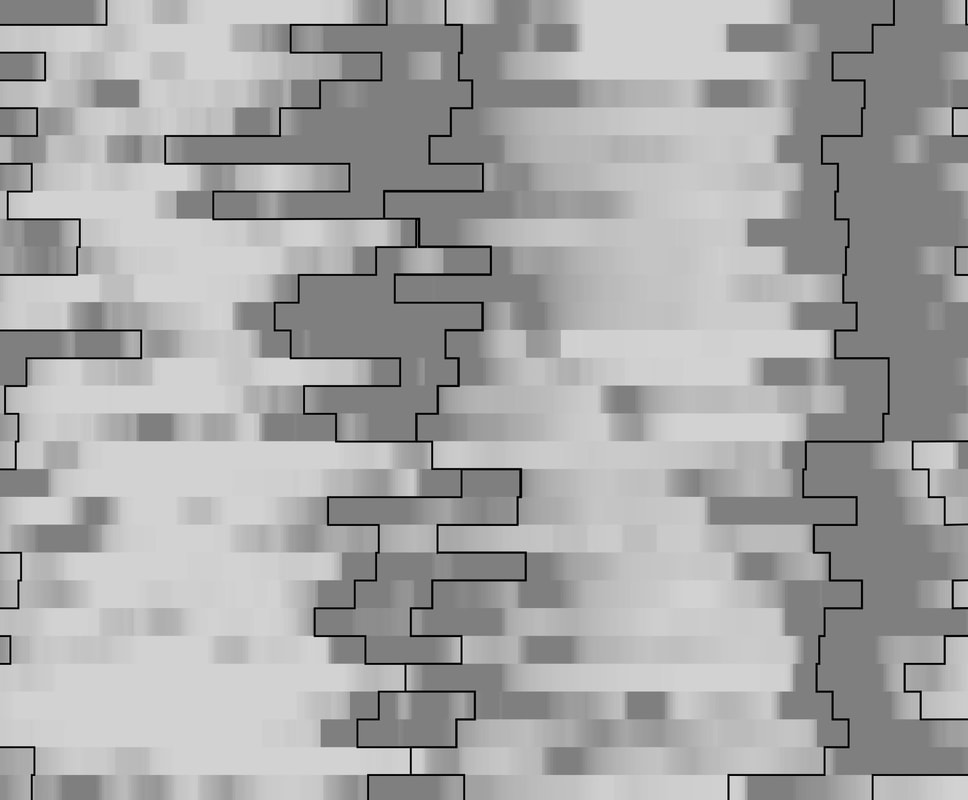
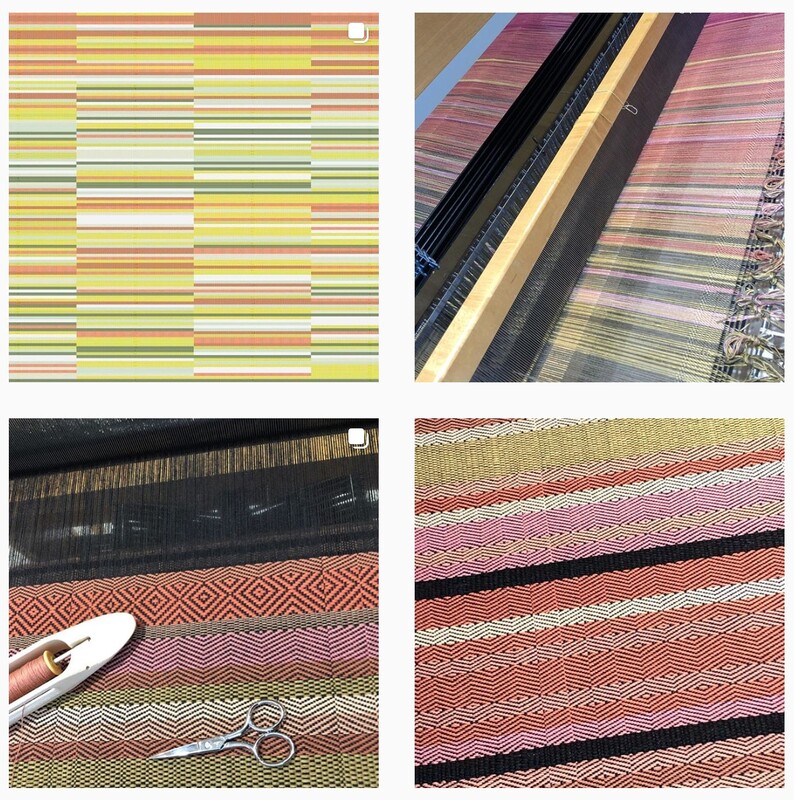
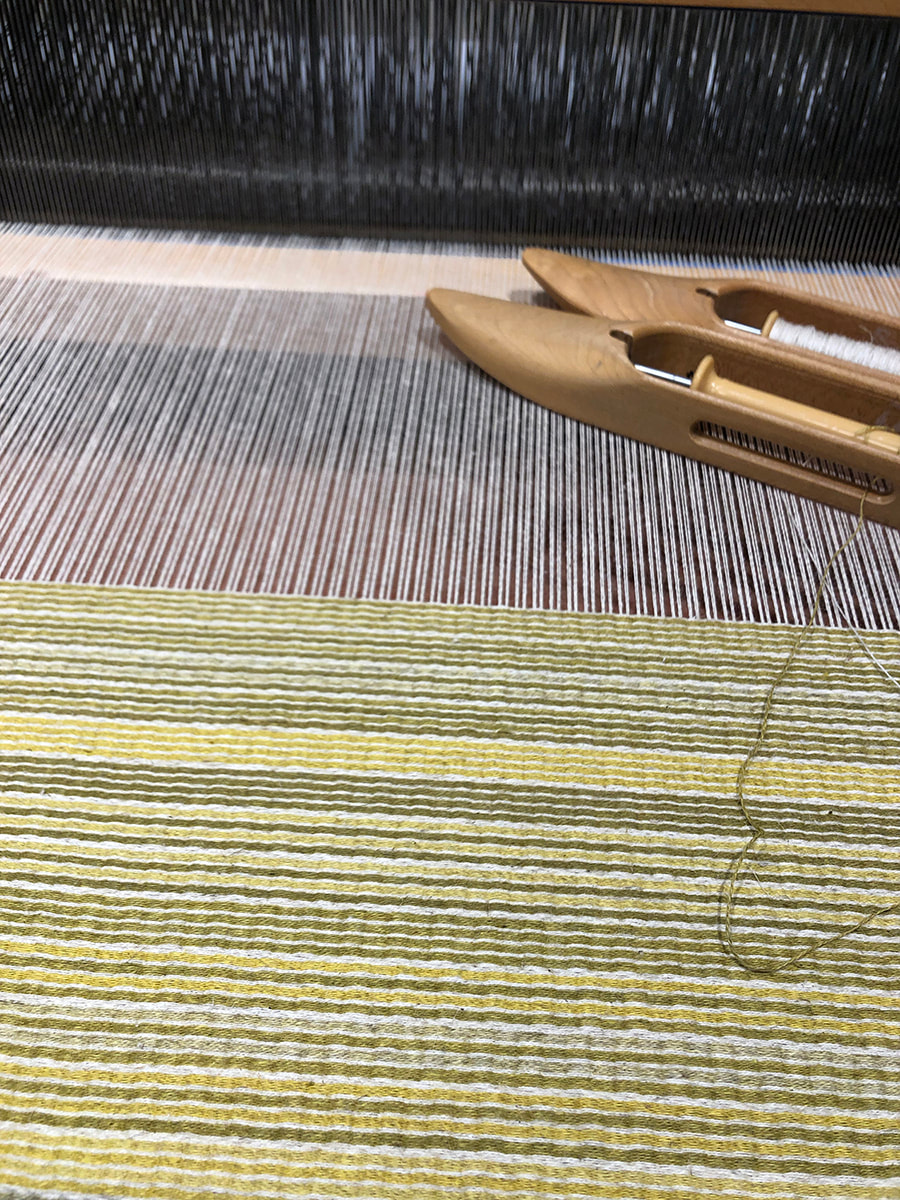
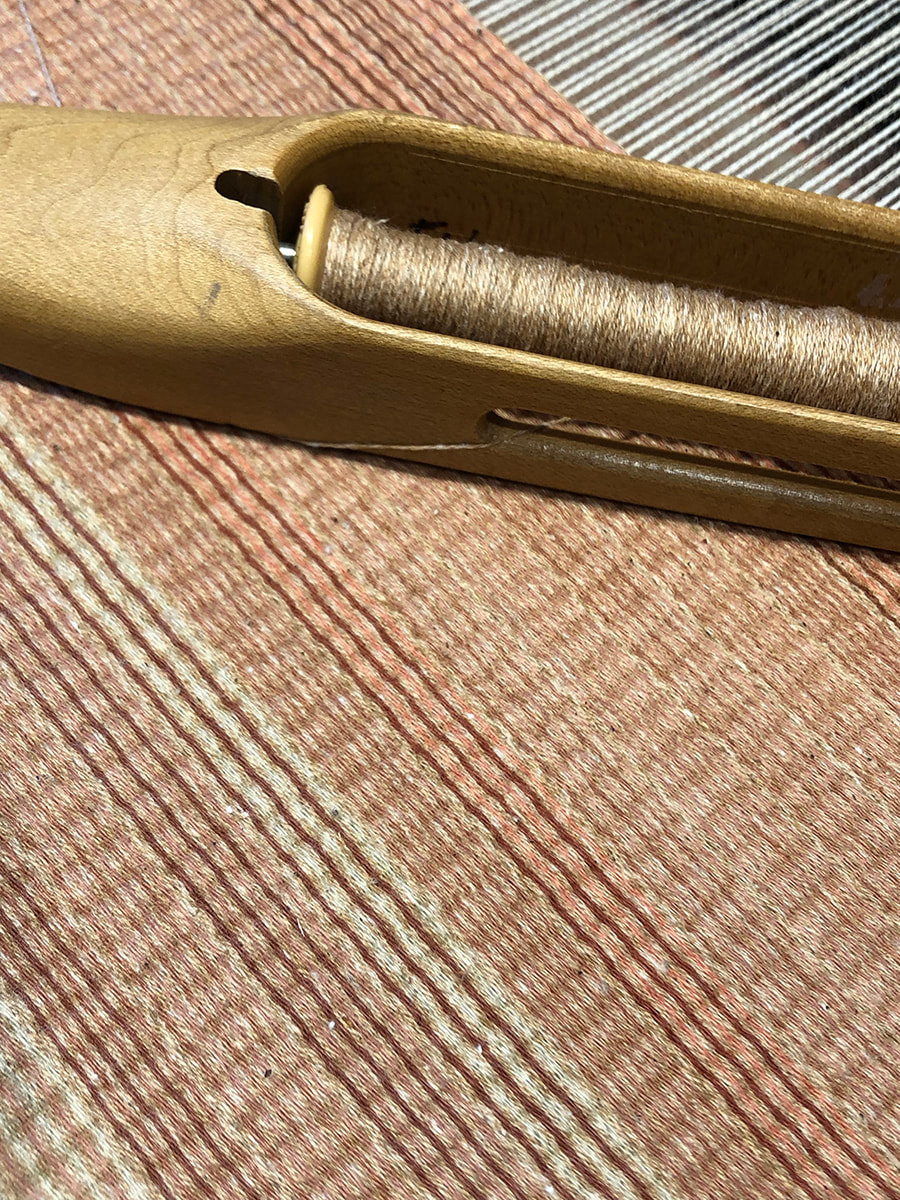
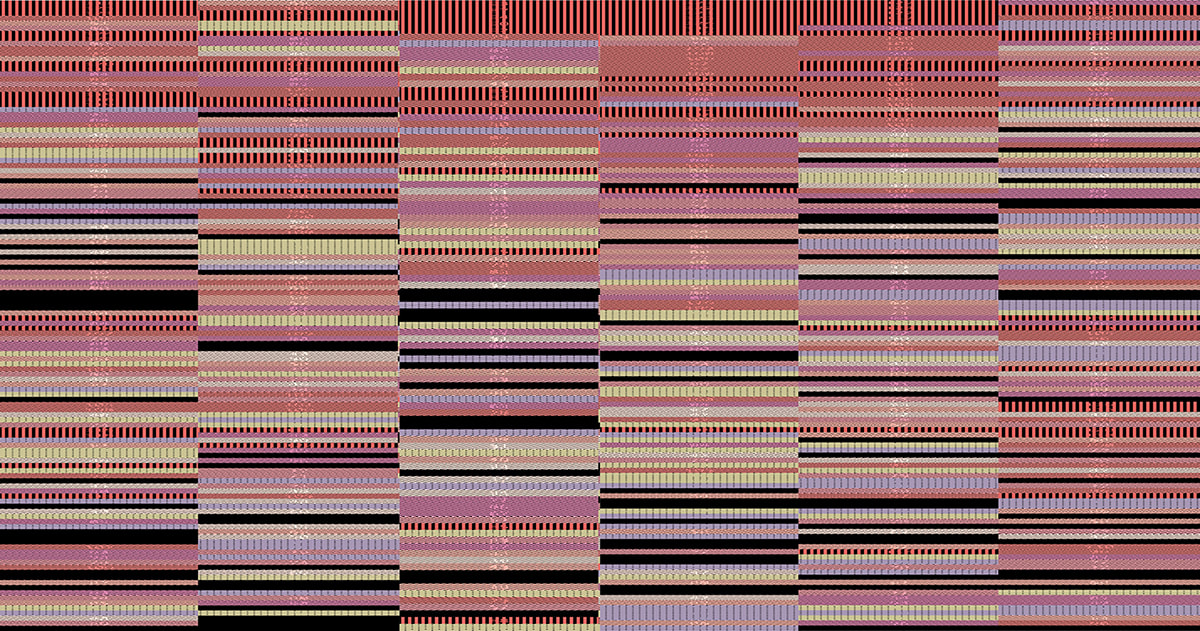
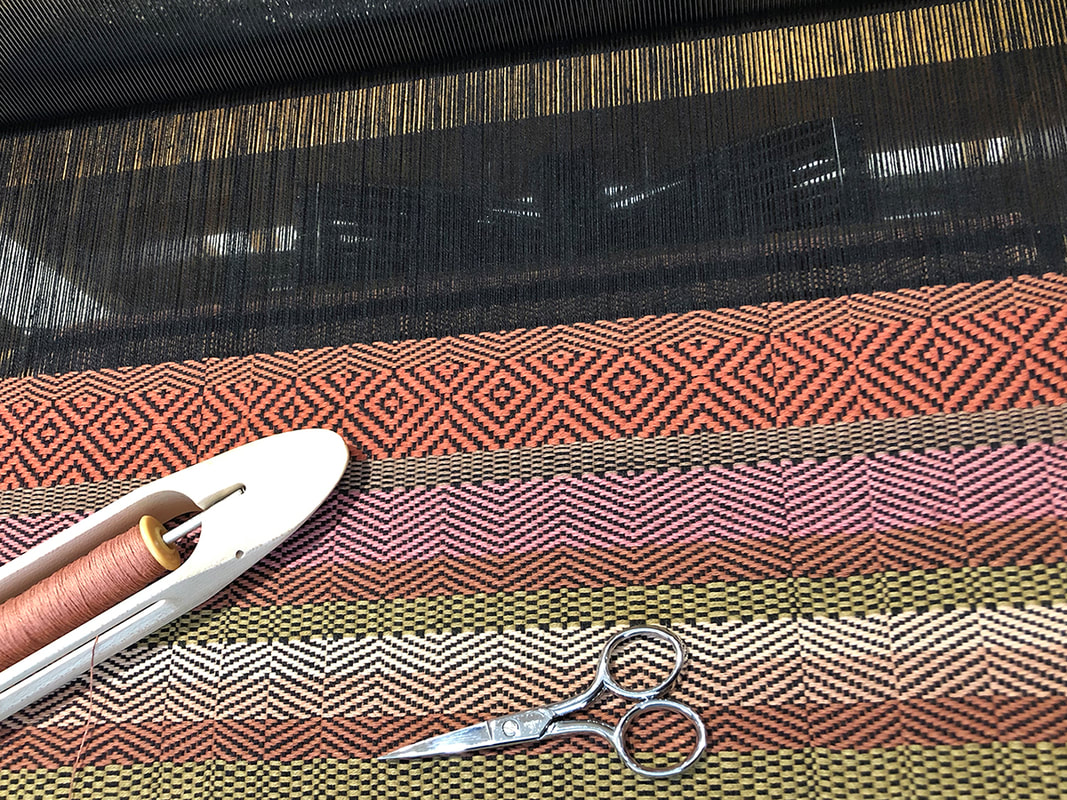
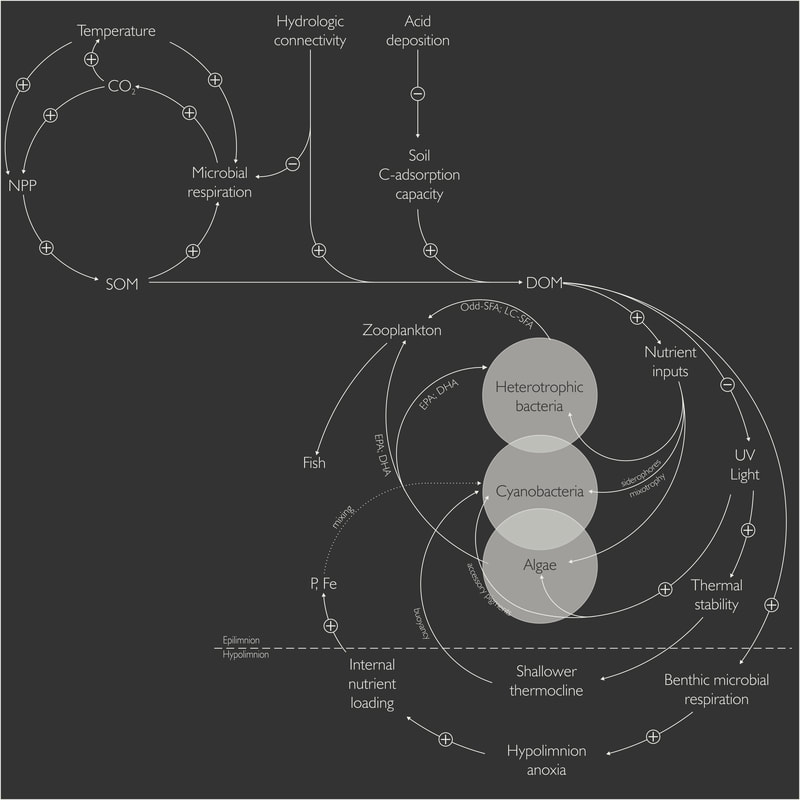
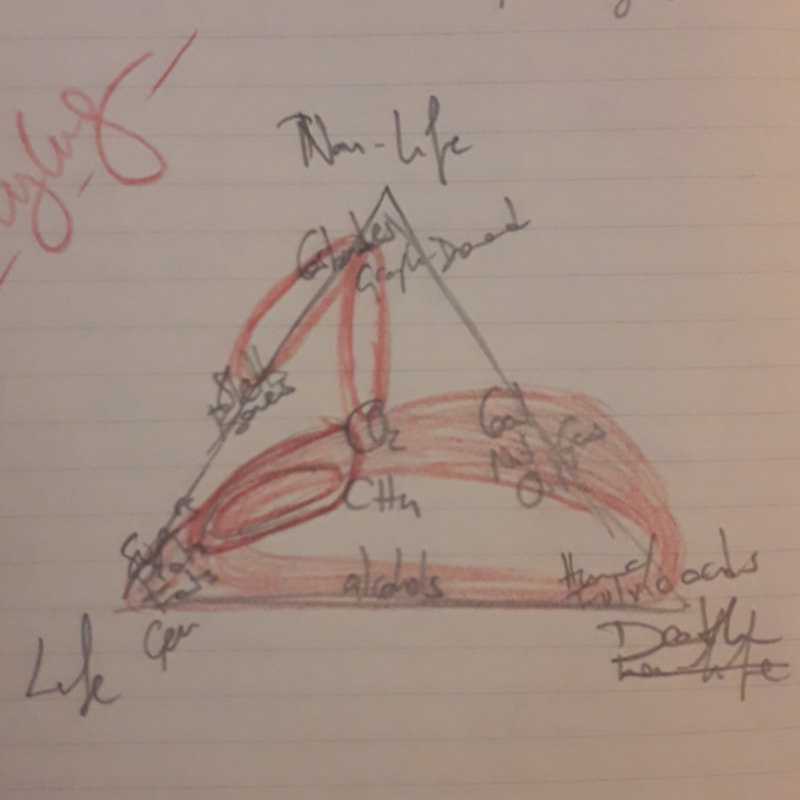
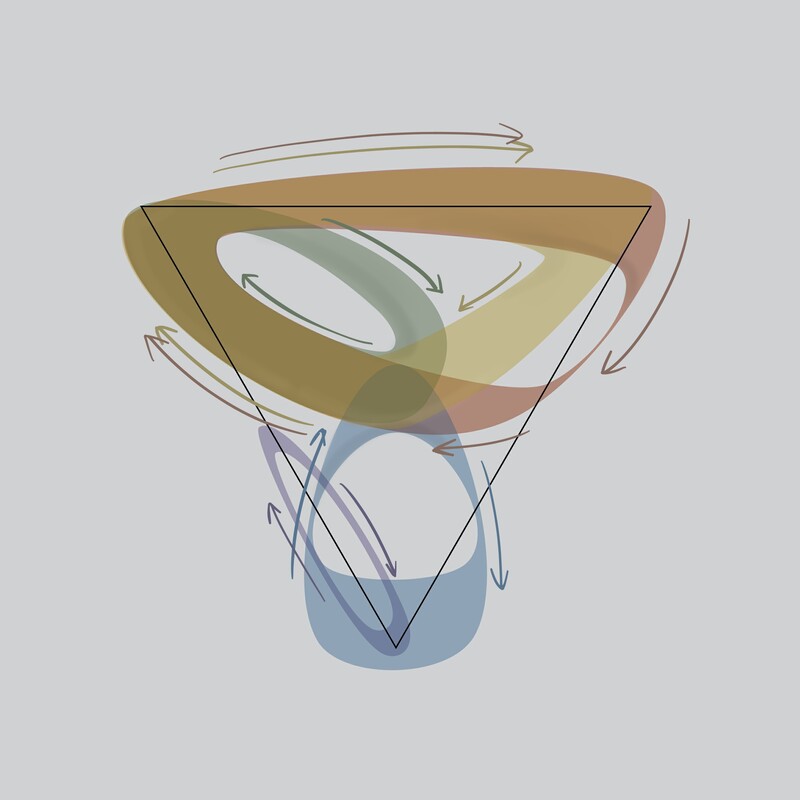
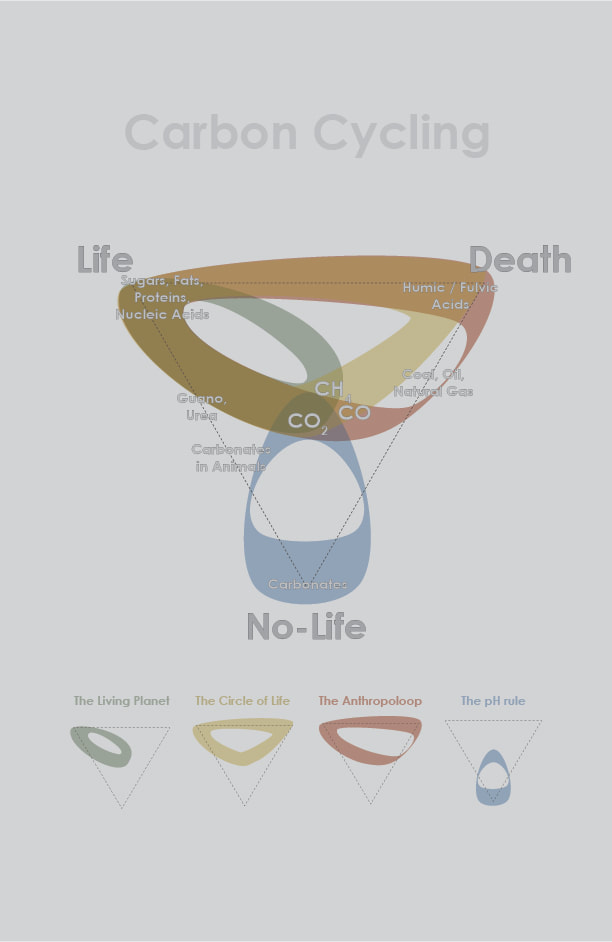
Thank you SciArt! I am excited to start working with Oscar and see where our conversation and collaboration leads! I am a multidisciplinary visual artist, currently based in Oklahoma as a Tulsa Artist Fellow. For the last several years, I have been working with climate data from the National Oceanic and Atmospheric Administration (NOAA). I translate the data into abstracted woven landscapes and waterscapes, materializing the data with plant-derived fibers and dyes. These datascapes merge a practice of record keeping with a practice of grieving and merge an expression of scientific research with an expression of lived experience. I view weaving as a way to sense what is often obscured in a data visualization: time, labor, connection to place, grief, care, and the material/organic origins of data. I also view this work as situated within a long history of weaving as a subversive language for women and marginalized groups: In this context the datascapes become a kind of feminist, material archive of climate knowledge, care, and attention in response to the current politics of erasure and climate violence. As I start this collaboration, I am also finishing up several new series of datascapes, likely the end of my work with this particular NOAA database. These new datascapes will all be in a solo exhibition “Beyond Measure” opening in Tulsa, OK at the end of October. Since you can see earlier finished datascapes on my website, I thought I would use this first post to share images of some of the work in progress. “Dislocations” is a series of four weavings (each approximately 36"x70") that interweaves climate data for places I've called home (Illinois, New York, California, Oklahoma) and memories of that place's landscapes with climate data for the world's oceans. These photos are of Illinois and Oklahoma on the loom. The color and composition for Dislocations (IL) is informed by the corn fields that surrounded my hometown growing up, while the color and composition of Dislocations (OK) is influenced by the state’s iconic red dirt and rocky earth. “Fault Lines” are a series of woven portraits for the top fossil fuel extracting states in the U.S, composed of climate data from those states (one for the 6 top oil extracting states, one for natural gas, and one for coal). Each piece in the “Fault Lines” series is comprised of six woven panels stitched together into a piece that is 9.5’ x 5’, the dimension of flags used to drape military caskets. The process of design each datascape involves several steps. After downloading the data, I use Excel spreadsheets to experiment with various color codes and weave structures (patterns). I have included an example of a spreadsheet “sketch” for Fault Lines-Oil as well as a fragment of the weaving in progress on the loom. My work with NOAA data has continued to open up new questions. I have become particularly interested in the non-human origins of data and the embodied process of collecting and interpreting data. Through this residency, I am very much looking forward to learning from Oscar’s research as a geographer and landscape ecologist and seeing what projects emerge from our dialogue. Oscar Carbon is life. Carbon atoms combine with others to build the molecules that constitute the basis of cells and tissues. Carbon is present in bacteria, in plants, in animals, in algae and in fungi; and on the Earth’s surface, plants are in charge of building life from non-living carbon compounds. Carbon makes up natural fibers and organic pigments; carbon is art. Carbon is the absence of life. Carbon is in the Earth’s crust, in CO2 that is emitted through respiration and combustion, and that is exchanged between atmosphere and oceans. In fact, most of the Earth’s carbon is stored in rocks and oceans. Carbon is in diamonds, in marble, and in graphite; carbon is art. Carbon is death. Carbon is released from decaying leaves and animals in forest soils by bacteria. It is emitted as CO2 and transformed into other compounds that will dissolve in water and flow through streams, lakes, and rivers, before reaching the oceans. Carbon is in constant motion. And motion is the cause of all life. Carbon is history. Agricultural and industrial practices and our reliance on carbon-based energy sources have given carbon the status of defining element of our times. The Anthropocene is (allegedly) the current geological epoch, in which human action is the major driving force of the planet. Carbon is change. For the past years, my research has focused on how changing climate influences the transfer of carbon between terrestrial and freshwater systems in temperate forested landscapes. These alterations in carbon fluxes have the power to trigger algal blooms and put food quality at risk even in remote lakes. Dealing with diverse data from different sources, I learnt to appreciate the power of visualization as a tool to explore and communicate these complex ecological processes. In this context, and in times of rapid change and information overload, it is important that scientific findings reach the general public. Acting at the intersection of arts and sciences has the potential to explore, communicate, and inform about these changes. After all, if carbon is change, SciArt is a medium for resilience. A very improvised, quick, (probably inaccurate), and subjective take on carbon cycling (also a work in progress)
|

