|
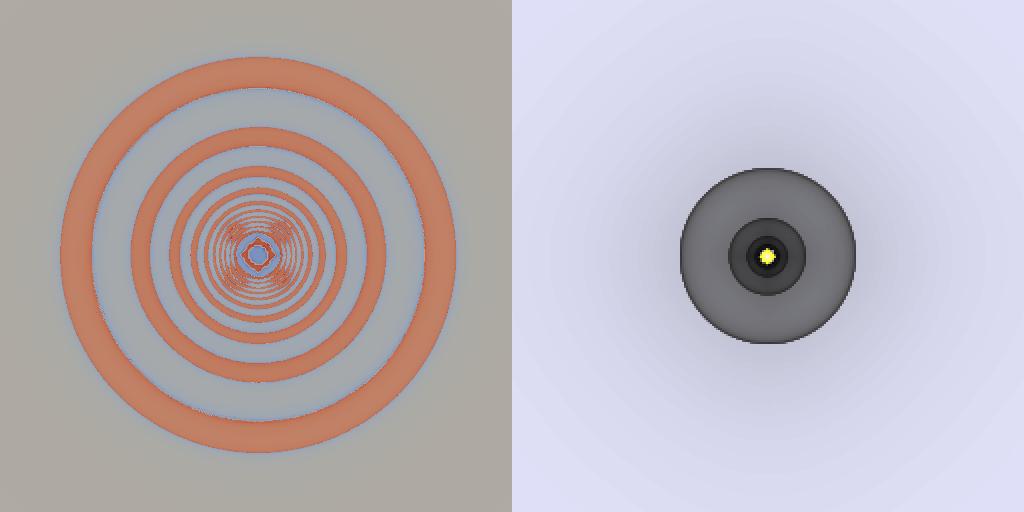
This week, I experimented a bit and looked into how to refine a 3D structure in the spirit of "jitterbugs" (see earlier posts), containing correlations of node spins similar to those we might find in nature. I wanted to produce the sorts of rotations present in the model I built from straws (see Week 2 video). It seemed that the 3D-printed models I was using did not enable enough freedom for the blue tetrahedra to wiggle around in addition to turn, so I loosened them a bit. But finally, as I was exploring how to do this, I realized that actually, the sorts of rotation in the straws video were rather different from the sorts of modes of rotation expected in nature. The key effect I wanted to capture was that galaxies joined by "filaments" tended to have similar rotations, but this model may deform the filament too much. It would be great if we could explicitly add rotating rods joined by some sort of hinges of nodes in a network ... These sorts of rotating rods in a network might have some interesting mathematical properties. The sense of rotation (clockwise or counterclockwise) gets preserved through the network like water flowing through the straws that I made my initial model out of, and certain combinations of clockwise and counterclockwise would turn out to be impossible. In any case, this rotating-rod model might be too much for the project with Lizzy, since I myself have trouble fully grasping its properties ... While I continue to think about how to make something along those lines work, I will get more heavily involved with helping Lizzy to wrangle the data from my simulations. The video is a new one I made for my research, similar to one from last week, but with more compact nodes (thus, they are less likely to form filaments folds between them). The left-hand panel is a "crease pattern" for folding up the structures whose densities are shown at right. The blue regions end up face-up in the folded image, while the red regions end up face-down. The curves between the two colors are where the sheet would get folded. Don't try folding this at home though! In fact, to accurately fold the patterns at right, you would need an extra spatial dimension, since a 2-dimensional dark-matter sheet folds up in 4 dimensional phase space (with the added 2 dimensions of velocity.) I have also changed the color scale so that the highest-density pixels in the right panels turn yellow, suggestive of star formation. That is what happens in nature, roughly -- only the highest-density places in the universe are where stars form. Surprisingly, some of these highest-density points are along the edges of the structure -- this could be a way to test whether dark matter truly does nothing special when it collides with other patches of dark matter, as assumed for this simulation. This "collisionlessness" is the only way it is possible to get several layers of the sheet to overlap, with different velocities, in the same location. Another interesting thing about this video is that the "Cairo pentagonal tessellation pattern" (see https://en.wikipedia.org/wiki/Cairo_pentagonal_tiling) extends even into the inner structures of the blobs. Usually, the dynamics inside collapsed structures like this are thought to be too complicated to understand, but the persistence of this pattern inside the blob raises some hope that we can understand the formation of that structure. More philosophically, it may indicate a way that the arrangement of blobs around a galaxy (like Andromeda around our Milky Way) influences the structure inside our Galaxy. To see how the tessellation pattern influences the pattern, look at the below figure, a frame from a similar video when only one blob is on its own, without any influence from neighbors. All the boundaries are entirely circular, not the polygons we see when blobs form with external influence. Anyway, until next week! -Mark Lizzy's update
I have been thinking about the simulation data Mark has sent in the form of some position-velocity phase portraits, video, and snapshots. I’ll be assembling everything into a blog that I can access like a virtual sketchbook! I’m really interested in getting visually acquainted with the imagery, talking with Mark about how it fits into his work, and musing with him on sharing this side of scientists’ work. Dark matter is a colossal topic. Cosmology research scratches the itch of our wondering how the universe exists the way it does. The research implies that patterns pervade not only large scale structures, but are preserved inside dense areas as well. The most counter-intuitive element to all of this that I’ve come across is that the “sheet of paper” stretches in void areas and bunches up in dense areas. Neither a paper model, nor the 3D model we’re brainstorming solve that visualization problem. This concept carries over to 3D space as well, which means the dark matter sheet (remember, three-dimensional), twisting and folding into dense pockets, attracts ordinary matter into the densest regions, while the void space in between stretches, further pushing the dark matter sheet, and ordinary matter, into denser and denser folded patterns. I used to think galaxies formed because of black holes. I honestly had no idea dark matter played the type of role it does according to Mark’s research! Something that tipped scientists off to dark matter’s significance was the discrepancy between calculated mass of galaxies according to their black hole activity vs. observed mass. There was far more mass recorded than calculated, which meant something else must be attracting and aggregating matter. Enter: Dark Matter, so called because it is as-of-yet unobservable except by its effects. This anecdote is just one of many that illustrates the importance of the scientific method, testing hypotheses with designed experiments, and analyzing the results for what you perhaps weren’t expecting to see. Without the ability to abstract observations into some quantitative data, some meaningful findings, and do so concisely, there would be no science! Not only is that abstraction interesting to me cognitively, the subsequent imperative to represent that abstraction in order to communicate it efficiently has probably evolutionarily shaped our entire systems of communication and representation. Plotting is one of those abstract communication tools that is just conceptually so rich to me. This is why I’d like to look at Mark’s data, plots, and graphs and make some art out of and about them. I'm planning out some projects now, and will let you know next week when I can expect to have some work to share!
1 Comment
|
Visit our other residency group's blogs HERE
Lizzy Storm is an artist and owner of Lizzy Storm Designs based in Atlanta, Georgia.
Mark Neyrinck is an award-winning astrophysicist and cosmologist, and a postdoctoral researcher at Durham University, United Kingdom.
|


