|
Mark's update I'm so glad I had the chance to interact with Lizzy over these 4 months; hard to believe the formal residency period is already over! But I fully expect that we'll continue working together. The weekly blog turned out to be a great way to brainstorm and test some things out, but I think actually moving into the next phase may end up being helpful as well, to bring our ideas to fruition and produce something very cool. This art is likely to take the form of a 3D sculpture. One inspiration may be Transparent Void of a Tree by Sou Fujimoto, which I saw in the Victoria & Albert Museum in London (see also the video in my blog from last week) 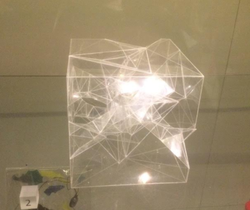 It would be really cool to build something similar to this (which, itself, is a model for something human-scale!): a 3D origami model of the local universe. I have some ideas for a method to make the closest-possible origami-tessellation approximation to an observed set of galaxies; it would be super-cool to make a human-scale model of the local universe that best-fits actual data. Lizzy suggested the possibility of using subtly colored panels. That could really help (over entirely transparent panels) to elucidate the structure by eye! Another aspect that would be fantastic to incorporate would be filament and galaxy rotations; this would give one some sense of how things are likely to be moving in the cosmic web. A few of my blog entries were devoted to this idea, sparked by Lizzy's mention of Ron Resch and "jitterbugs". This work ended up clarifying the model conceptually for me, already, and I think I have a pretty good idea of how to construct such a rotational node with something like 3D-printed "gears", quite interesting stuff in its own right. Incidentally, I just saw a video about "reconfigurable materials", related to origami, jitterbugs, and engineering: https://www.facebook.com/RocketsAreCool/videos/1092808120848718/ or a similar non-Facebook video: https://www.youtube.com/watch?v=7A_jPky3jRY These videos concern recent Nature paper by this group, "Rational design of reconfigurable prismatic architected materials" http://www.nature.com/nature/journal/v541/n7637/full/nature20824.html The article is hosted without a paywall on the authors' website, as well: http://bertoldi.seas.harvard.edu/publications/rational-design-reconfigurable-prismatic-architected-materials I also picked up a book recently, largely about related topics: polyhedra, math, art and science. It's Shaping Space: Exploring Polyhedra in Nature, Art, and the Geometrical Imagination, edited by Marjorie Senechal. I haven't had time to look at at much, but it looks very cool. As this project started, I was mainly in the mode of "finding cool ways to explain cool science," rather than thinking deeply of a meaningful dialogue between artistic and scientific ways of seeing the world. (Although when I look back at "finding cool ways to explain cool science," the word "cool" could implicitly contain some thought along more meaningful lines -- to be "cool," it has to engage the viewer in some probably artistic way.) I think the biggest way in which the SciArt residency has helped me to broaden my point of view is in this way -- pondering how people might connect to scientific art, and how it can have profound meaning beyond simply illustrating a clinical scientific principle. The biggest insight I had during this period was (I think) along these lines, with both scientific and broader human meaning: when galaxies form in the cosmic web, much of their inner structure is a reflection of the structure around them. A "Tantra Art" group I'm getting involved with Prof. Chris Dorsett and others at Northumberland University further encourages this kind of thought. My way of thinking of science and art and how they can interact has already changed a bit, but I still have much to learn! And to conclude a bit self-promotionally, a couple of events that are coming up soon for me; this will be more in the format of a weekly blog entry (I hope, anticipating further blog entries!) - I will be featured (I was told! I haven't viewed it yet) in a NOVA program on PBS, scheduled for Feb 15, http://www.pbs.org/wgbh/nova/physics/origami-revolution.html. Origami cosmology and I occupy several minutes near the end, out of the hour-long show. It's not just recommended for viewing me, but there are many other very cool topics included of SciArt relevance! - I will be giving a seminar at Paper Studio Northumberland in Newcastle, England, tentatively on March 23 and with the title "Origami-Folding the Local Universe". This is a folded-up draft of the model. 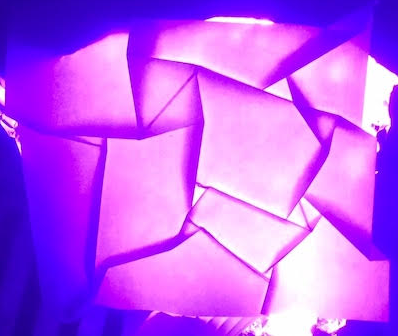 It's a model of the set of galaxies in the "Council of Giants", https://www.youtube.com/watch?v=VzL7xGzfNlU. Incidentally, the music there was a subject of an interesting conversation with Northumberland art professor Fiona Crisp. I realized that in a scientific talk, I would be a bit embarrassed to show it along with its music, probably making a small joke about the music. I think in science, we tend to be very wary of things that could be construed as obvious salesmanship, or things that attempt to influence us in ways that seem to be "cheating" in a way that seems capable of circumventing a scientist's idealized filter of cold logic and reason. But the galaxies in the Council of Giants truly are giants (technically, galaxies roughly the size of our own, as opposed to "dwarf galaxies", such as the large and small Magellanic clouds near our Milky Way). Upon further in(tro)spection, the music here is not inappropriate! This thought about the music is yet another piece of SciArt thinking that the residency has enabled for me. Of course I thank Julia Buntaine, Marnie Benney, SciArt Center, everyone involved with The Bridge program, and of course my partner, Lizzy. I look forward to a lot more thought, work, discussion, and actualization along these lines! Lizzy's update
In our 4 month collaboration, Mark and I explored the art and science connection from a few different angles. At first, it was up to me to come up to speed on his research interests and projects. I enjoyed reading and discussing some publications he created and contributed to, as well as getting periodical updates on publicity for his origami, dark matter sheet connection. Then came time for Mark to understand how I work as a studio artist. Together, we talked about ways to communicate the imagery from his research, such as plots and animated simulations, in a context that honors the hard work behind it in addition to inviting laymen to observe and enjoy that work. We’re still thinking about three-dimensional origami folding possibilities! Mark did a lot of work on figuring out how to manifest a physical 3-D working model of his concept of tetrahedral collapse used to describe the strange 6-dimensional folding nature of the dark matter sheet. It took many weeks for me to get my hands into some materials and prepare for making artwork. A lot of planning goes into my projects to make them financially and temporally feasible. I was prepared from the beginning of our collaboration to use our formal time together to gather raw materials to draw from, while encouraging Mark to see the many facets of art, design, and craft. In keeping with the conceptual nature of my work, Mark continually encouraged me to fully understand the concepts at hand before claiming to make a statement about them from which to gain inspiration. Our collaboration progressed very organically. We each maintained our other obligations while making time every week to answer each others questions and read each others musings and thoughts. It was harder to get into regular video chats considering our time difference. I did have a very hard time wrapping my head around the origami folding of the dark matter sheet! It took me some weeks to come around, sometimes aided by visualizations, sometimes made more confused! Now I feel like I can visualize the way Mark models the origami folding in my mind’s eye, going so far as to replace an outdated notion of mine that galaxies and galaxy clusters were formed based on the gravity of massive bodies alone. In fact, this very shift in thought was what turned scientists on to dark matter in the first place. Based on observations and calculations from nearby galaxies, far less visible matter was apparent than there would be if galaxies were formed due to gravity alone. Something else had to be drawing matter together. Dark matter could be it! Mark has aided this research by developing simulation techniques that take less time and computational power. Without a doubt, the best part of this collaboration was hearing Mark say that his visualizations surprised him and his colleagues. There was far more detail in the nodes than was postulated. Not only detail, but almost a fractal nature as one zooms in to the smaller and smaller folds, finding the same patterns repeated at different scales. Where would they be without visualization? Our running projects include: 3D Tetrahedral Collapse physical model, origami twist fold models from the observed universe and our own Milky Way and neighboring galaxies, and a few series of drawings, paintings, prints, (and maybe sculpture!), using data visualization from Mark’s research. I see us each moving forward on our projects while we remain distanced by the Atlantic. We have talked about getting together in New York for an event or exhibition showcasing our work! I would even be interested in a publication to go along with the exhibition, a poetic takeaway containing images of work and writing from each of us, that would serve to contextualize the fruits of this endeavor. I would like to finish by introducing you to a casual blog I’ve created to document the inspiration and references for our collaboration. You can find it athttps://sciartcollaboration.tumblr.com/ While you can find a much more detailed account on our official blog right here at the SciArt Center website, which we will continue to update as we have progress and announcements to share, the blog linked above will be filled with more visuals, links, and thoughts relating to our collaboration in a much broader sense. I hope it inspires you to connect to more sciart in your life! Thank you all who have kept up with our projects by reading our weekly blog posts facilitated by the SciArt Center, and thank you to SciArt Center director Julia Buntaine for bringing us all together to bridge the perceived gap between science and art!
0 Comments
Mark's update I'm currently on a train back to Durham from London, where I went to a seminar called "Thinking Tantra: On waking up, say a spell backwards ..." It was led by professor Chris Dorsett from Northumbria University. It was quite a stimulating discussion, with about 10 people, set in a gallery, The Drawing Room, and it concerned the exhibition currently there, "Thinking Tantra." One thing that was of particular interest to our project was how the ideas of time and space in a yantra work. The origin (of the universe? I don't entirely understand) is in the center of the diagram, and one is supposed to meditate on the yantra from the outside in. This reminded me of a node of concentric shapes in a crease pattern producing a galaxy in one of my simulations (occurring in an earlier blog, http://www.sciartcenter.org/uploads/6/0/8/9/6089526/image_2_orig.png) grows from inside out the patch in the center collapses first, and oscillates (falling in through the center, then back out) ... as each patch falls in from the outside, it starts to oscillate as well, with an ever-increasing period. I've also written before about how the inner structure of these nodes is determined by the pattern of nodes around it -- this reminded someone at the seminar about Indra's net. From Wikipedia, "Indra's net is the net of the Vedic god Indra, whose net hangs over his palace on Mount Meru, the axis mundi of Hindu cosmology and Hindu mythology. Indra's net has a multifaceted jewel at each vertex, and each jewel is reflected in all of the other jewels." Mount Meru, incidentally, is the hill at the very center of one of these yantras. I'm not claiming that this indicates some deep religious truth, but the intellectual link is still fascinating. Yesterday, at the Victoria & Albert Museum, I saw a captivating miniature version of "Transparent Void of a Tree", a huge installation by Sou Fukimoto in 2009 - this may be a good way to represent the origami of the 3D dark-matter sheet: I'll end with a piece I saw at Thinking Tantra, by Alex Gorlizki: 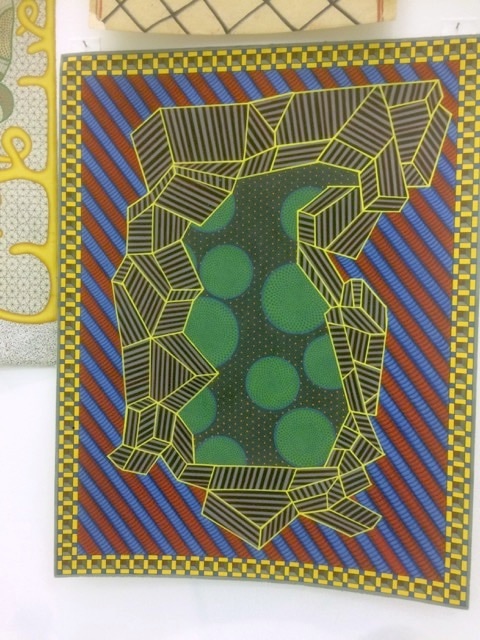 Lizzy's update
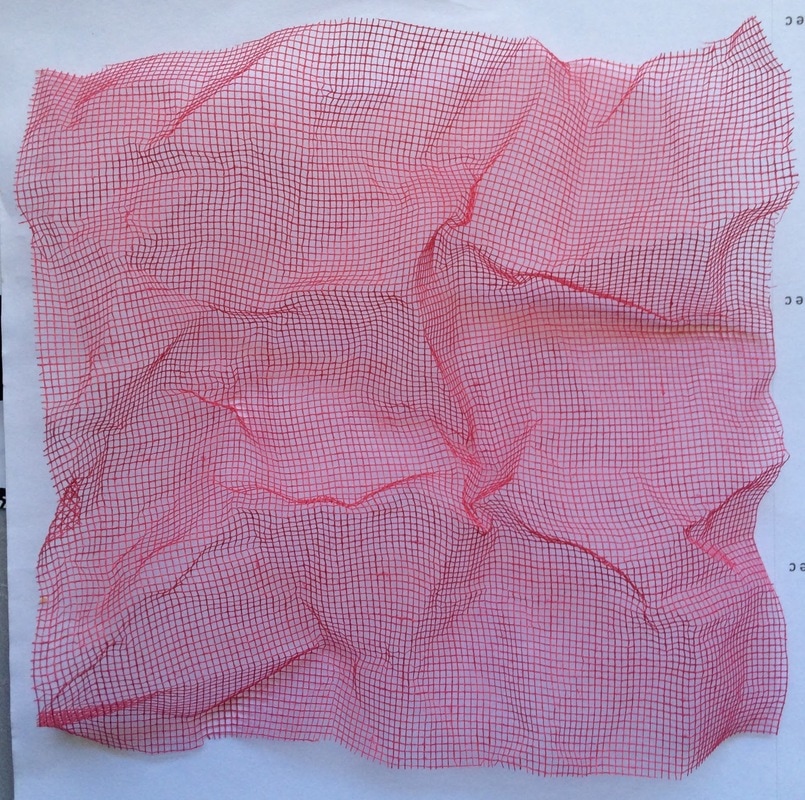
Admittedly, I have had a hard time focusing this past week. Between US news headlines and, well… more US news headlines, I’ve been spending time reading and making phone calls. That doesn’t mean my mind will not wander to dark matter and cosmology! Last week, Mark replied to my blog post with some insights that have kept my imagination churning… “About the tensile strength, etc. of the dark-matter sheet ... the only thing in principle that can "tear" it is the ultimately discrete nature of the sheet, on the level of particles. The particles seem to be about the mass of a heavy atomic nucleus (such as, evocatively, gold, I seem to recall -- but the mass could range within a couple of orders of magnitude of that, so probably someone was just trying to be evocative there) That's still dozens of orders of magnitude smaller than a particle typically used in a simulation -- that's why the dark matter sheet approach is more accurate than treating the dark matter as a literal particle, typically millions of times the mass of the sun! Another place where "tearing" might happen would be around a black hole, because the sheet would get so wrapped around. That's a scenario that I've wanted to think about more but haven't had a chance to ... black holes are weird, as you know ... actually in some respects, things that enter them stay outside, plastered on the surface, but get "infinitely redshifted" and so effectively disappear.” I love the way my mind wanders at the above mention of the “discrete nature of the sheet.” ‘Sheet’ generally impliescontinuity. But it follows that if all matter is made up of molecules, atoms, and particles, then no matter is indeed “continuous.” ‘Discrete’ and ‘continuous’ are keywords from calculus that inspire me to examine them as concepts and represent them as paradoxical descriptions of reality, and yet as highly practical models that allow science to advance, let alone exist. The very calculus that lets scientists mathematically describe the strangeness of black holes! “You may realize this already, but the dark-matter sheet idea is not the same as as the "cosmic fabric" in the "Mechanics of Spacetime" paper -- based on my initial impression, their cosmic fabric is a layer of constant time, which can acquire ripples due to time dilation. As I understand it, the cosmic fabric actually would have overlapped with the dark-matter sheet when the density perturbations were very small, shortly after the big bang, but they become separate after that...” Oh, Mark. How you know I love to speculate! If Einstein had not speculated on the speed of light, where would we be today? But I digress. It is not always helpful to speculate this way. That just means I have an entire new world in the fabric of spacetime to investigate through fine art! Mark did some travel this week to attend a conference at Northumbria University on Tantra. Just 15 or 30 seconds of focusing on the Sri Yantra image linked in his update this week (focus on it from the outside, in) has me thinking how much 3-dimensionality the image has, almost as a sort of optical illusion. Specifically, it resembles a spherical half dome from above, to me. My awareness of Hindu temple architecture brings in the layer of knowing that these diagrams were used to determine foundations and sacred building and spacial design, meaning the design of these buildings would reflect and harmonize with the “design” of the universe. “As above, so below…” Interesting points to consider in the creation of artwork inspired by these ideas… I am so impressed by Mark’s willingness to entertain the concepts drawn from the intersection of art and science. It seemed at the beginning of our collaboration that, while he had thought and worked with origami in a broad, intersectional manner, he had not thought of “fine art” as truly relatable. His musings on the conference “Thinking Tantra…” demonstrate that new avenues of thought are opening up for him! The metaphor of Indra’s Net has an amazing connection to the cosmic web. The core principle is that at each node of Indra’s net, a magical jewel resides that reflects each and every other jewel at every other node, ad infinitum. The net represents the interconnectedness of the universe. As I read his update, it was almost like traveling a well-worn path, like picking up a bicycle for the first time in years and remembering exactly how to use it. Had I thought of this before? Likely, just never wrote it down. The conceptual overlap leads me to thinking about quantum entanglement, and the theory of the Big Bang, and a new addition, the peculiar dark matter sheet simulations that show how each node is influenced by nodes around it. The intellectual nature of Hindu mythology and cosmology is deeply fascinating as it reveals intersecting layers at vast and minuscule scales, offering a paradox here and there to disrupt the mind’s propensity for logic. This connection to eastern religion has reminded me of the cosmological implications of Catholicism and Christian Mysticism, drawing closer to my own cultural upbringing. In reading Dante Alighieri’s Comedia in a dual liberal arts-studio course in 2012, I was amazed by the sensational descriptions of the heavens and the task of visualizing them as an illustrator. While classmates rendered human forms in varying stages of agony and ecstasy, remarkable pen and ink drawings of light, space, and scenery meant to evoke the mountainous and heavenly Purgatorio and Paradiso, I was stripping away all conventions of representation searching for a minimalist conceptual representation that would take the viewers mind to the “world” of Dante’s poem, a purely conceptual world. The same kind of world in which the concepts of mathematics and physics exist, the world of thought-problems and paradox, the world of reference frames and “ifs.” This is sometimes the only place that these concepts can exist. It was almost as if I was attempting to create something like a yantra for this meditative experience, a visual tool to pique the mind into a certain thought structure, within the context of Dante’s Comedia and medieval Christianity. On a final note, Mark said he was moved by a piece at the Victoria and Albert Museum that was created as part of an exhibition on the theme of “inside/outside.” The piece is titled “Transparent Void of a Tree” by Sou Fujimoto architects. Mark mentioned that the way this piece is fabricated, by edge-linked triangular sheets of transparent acrylic, might also be a good way to represent the origami of the 3D dark-matter sheet. Even the concept and title of the piece are worth chatting about. I see a project proposal in our future… Mark's update I'm working on an origami representation of the "Council of Giants", a name given by someone to our dozen or so nearest-neighbor large galaxies, in the so-called Local Sheet. This sheet has little to do with origami, or the "dark-matter sheet" that is relevant physically, but is just called a sheet that because the nearest galaxies, instead of filling out a full 3-dimensional space as they could, are roughly coplanar. I'm using Robert Lang's Tessellatica software, http://www.langorigami.com/article/tessellatica It's really amazing that he so generously put all that great code up there! Note: it does require Mathematica to run it. Anyway, it seems that the network of nodes I was feeding it wasn't quite "spiderweb" enough for a simple algorithm known as "shrink-rotate" to work everywhere (see the unfortunately paywalled http://www.crcnetbase.com/doi/abs/10.1201/b10971-40). In the picture below, the pink dashed lines (upper right) are supposed to be creases hidden under folds, but they aren't. (The stick figure represents the Milky Way)! Anyway, the design needs revision; I will either find the nearest-approximation "spiderweb" graph, or do something more manually ... 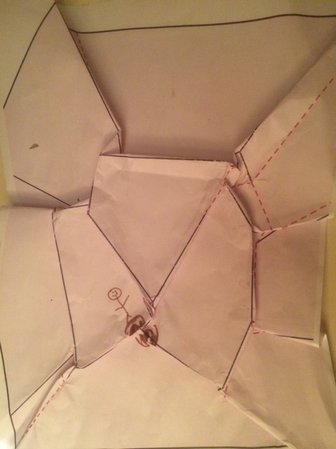 Also I wanted to point out a cool mathematical/geometrical art app that I just found, called iOrnament, https://itunes.apple.com/gb/app/iornament-draw-creative-geometry/id534529876?mt=8 https://www.facebook.com/IOrnament/ I just downloaded it myself so I can't endorse it fully yet, but it seems quite powerful, making it rather easy to make kaleidoscopic things somewhat like mandalas I discussed last week. Here's something from their Facebook page: 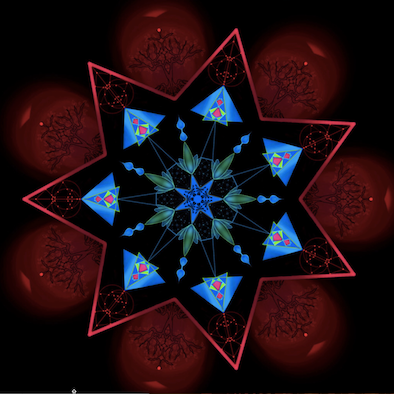 ...and here's something I quickly tried out (completely unrelated to cosmology, but with a 4-quadrant symmetry)  Anyway, more next week! Lizzy's update Mark and I both worked on a folded paper model of the Council of Giants this week. Our hope is that this piece will create a stepping stone for folks to get from structures visible and familiar to us, such as the Milky Way and nearby Andromeda galaxies, to large-scale structures like galaxy clusters and voids, through the similarity of their forms. He mentioned briefly in our chat this week that the model might not actually fold properly, but I went in full steam ahead anyway. I took a trip to my local art supply store looking for paper. I came away with some sheets of mulberry paper from the scrapbooking section, and a pack of “paper” branded for origami folding that is really rayon fabric mesh! In the spirit of Ron Resch (see first post) I examined the mesh paper, folded some parts to see how it would take the folds, and then simply crumpled the piece into my fist and let it go. In the film “Paper and Stick,” Resch describes his process of crumpling and unfolding paper to find and refine expandable folding patterns. The un-crumpled piece of rayon mesh looks familiar!
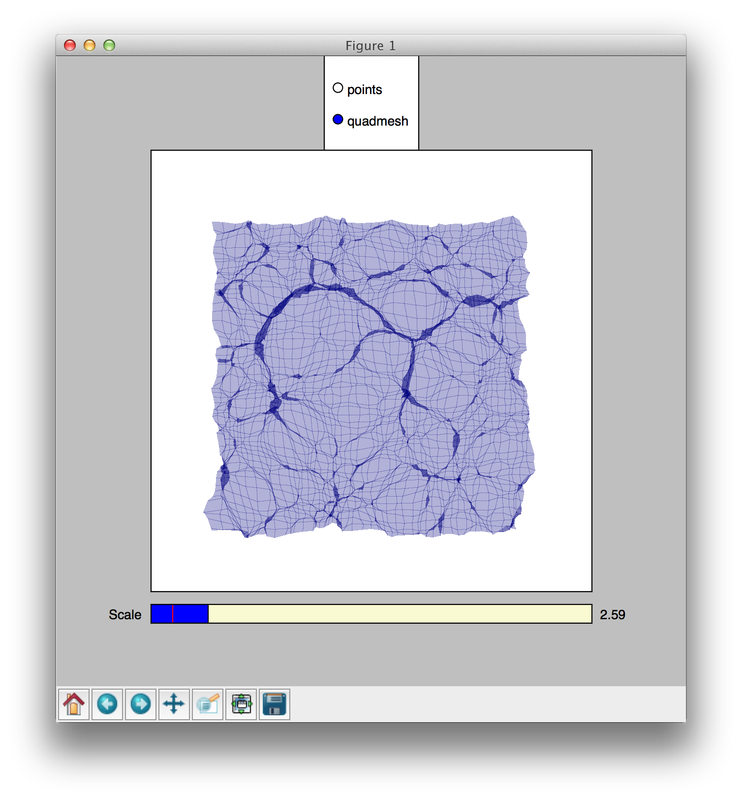
Right: crumpled rayon mesh. Left: detail of “Origami-Universe-4.png” from python source code for the “Fold Your Own Universe” NASA SpaceApp hackathon project, 2014. I look forward to seeing where this material takes me... Here is my folded model of the Council of Giants, created by Mark using Robert Lang’s Tessellatica software. 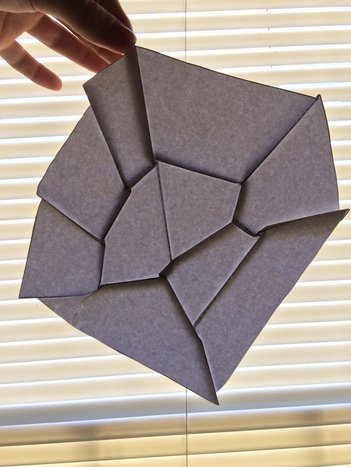 I think we both came to the conclusion that something is amiss, the twist folds are not quite there. Nevertheless, I got a nice close-up shot. 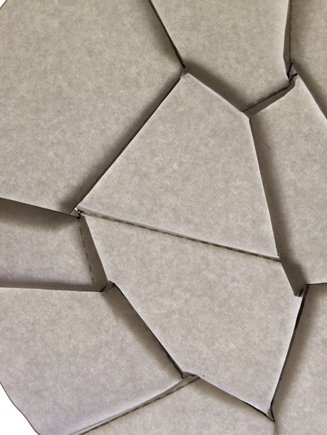 This pattern is quite literally an abstraction of reality. Abstract art, if I may. It’s expressive nature (how it makes the viewer feel) can be altered through the materials with which it is made and the context within which is is seen. Arguably, it is a bit underwhelming in its current form of folded-computer-paper-photo-taken-with-phone-camera-viewed-in-a-blog-post. It may be inexplicably more amazing in a refined material and context. It may also offer drastically new meanings if it were to be shown beside a piece of text… just some thoughts on the creation and exhibition of artwork inspired by scientific research. And, last but not least, here are photos of my experiments with this mulberry paper. It’s a bit too soft to have the active twist-folding effect that I was hoping to see (and video or stop-motion capture) although it did fold up nicely without showing creases everywhere, and I do appreciate the decorative element that the fibers provide. 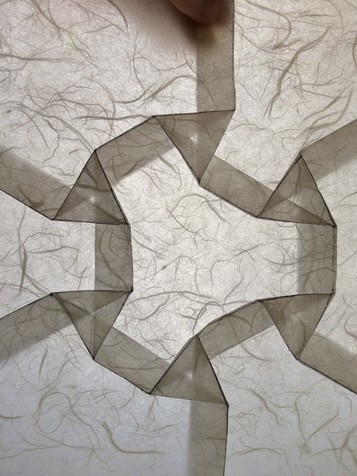 One of the tricks to good paper for folding is long fibers within the paper. These prevent the paper from ripping when folds are stressing it from stretching and compressing. Computer paper has short fibers, which you can actually see in the backlit closeup. This mulberry paper has long fibers criss-crossing throughout, making it uniformly strong. Folds made in any direction on this type of paper will not have the tendency to rip, and there will be less creasing. Paper differs from the Dark Matter Sheet in that way. The DMS is modeled as stretching in void areas and compressing in dense areas, eliminating the concept of ripping. Inspired by the engineers in my life, I wonder what the sheer stress of the fabric of spacetime would be, if there were one? In other words, at what point would the fabric of spacetime rip, due to gravity or otherwise? Maybe a pointless thought experiment. It turns out, a quick internet search will give you some answers: The Mechanics of Spacetime - A Solid Mechanics Perspective on the Theory of General Relativity, T. G. Tenev and M. F. Horstemeyer. (link will download PDF file of manuscript.) This leads me to wonder how to bring in a stretchy sheet of material, like a stretchy fabric or a metal screen, to these visualizations… and I’m off to fill my blog (which I will share shortly) with links to these inspirations and musings.
YANTRAS Still inspired by last week’s themes of Tantric diagrams, or yantras, I was led to a site that offers research into a commonly used and popular yantra known as the Sri Yantra called simply, “Sri Yantra Research Center” linked here. The Sri Yantra consists of 9 overlapping triangles and creates an interesting collection of angles and shapes. There has been some mathematical research into the form and a publication which claims to identify the specific angles that make an ‘optimal” Sri Yantra, which can be found on the site’s homepage. I'm interested in these geometric relationships, and I think they would make good raw material for further dark matter sheet simulation patterns. What interests me initially about yantras in conjunction with the scientific visualization of the early universe, or large scale structure in the universe, is the definition of a yantra as a diagram, a tool, or a figure used to illustrate a conception of cosmology or reality. Quoted from the page titled “Yantras,” In its first meaning, 'yantra' may refer to any kind of mechanical contrivance which is harnessed to aid an enterprise. A yantra in this sense, therefore, is any sort of machine or instrument such as is used in architecture, astronomy, alchemy, chemistry, warfare or recreation… They are, first of all, believed to reveal the inner basis of the forms and shapes abounding in the universe. Just as, whatever the outer structure, all matter is made of an intrinsic basic unity, the atom, so each aspect of the world can be seen in its structural form as a yantra. As the scientist sees the final picture of the world in the orderly, simple, atomic structures in which certain primal shapes appear as a harmonized 'whole', so the Indian shilpi-yogins (makers of ritual art) seek to identify the innermost structure of the universe by concentrating the variegated picture of world-appearances through intense yogic vision into simple form-equations. A yantra, then, can be considered an ultimate form-equation of a specific energy manifesting in the world. These simple form-equations are held to epitomize the real nature of the cosmos as abstracted from the concrete. [emphasis mine] I am not surprised by the analogy, from the standpoint of the spiritual, between scientist and makers of ritual art. (They even use the word “equation”!) I am more surprised by scientists’ seemingly unwillingness to examine how spiritualists conceive of the nature of reality and cosmology. Is it seen as a distraction? Perhaps. Perhaps it is only Western science that has broken completely from spirituality, a result of the Church denying the scientific truths discovered during the scientific revolution. Perhaps it is just my personal experience with staunchly atheist scientists. And yet, in recent years, popular science has come forth to the masses, such as in the form of television series like “Cosmos” and “Through the Wormhole”, with language and image that draw a direct connection between science and spirituality. For example, in a segment from “Through the Wormhole”, scientist Garrett Lisi is described by the narrator as having a “vision’ that led him to develop the algebraic Li group called E8, which purports to offer a unified theory of particle physics all the way through to gravity and force carriers. The segment can be viewed on YouTube here. “To us, it is just a mind-bending pattern, but to Garrett Lisi…” the narrator goes on describing the scientist’s “Ah-ha” moment. The video shows a beachside surf scene overlapping the scientist’s mathematical notebook (surf culture is very spiritual, and Lisi himself is an avid surfer). Lisi is quoted on video, “You know, seeing how gravity could be combined with these other Li groups during this unification was one of the greatest moments of my life [emphasis mine].” What is it that he saw, was it a mathematical vision? A pictorial vision? Was it a literal visual process aided by the geometric visualization shown in the segment? A combination of all of these? “Vision” and “seeing” seem to be ways of describing a (modern?) thought process or mental conclusion with no English word to truly define it. Instead, these ways of describing a discovery are borrowed from spirituality. The Sri Yantra Research Center homepage links to a video on E8 geometry. Would you expect to find an analogous link on a scientist's’ research page? There is still so much more to consider in this exploration of yantras and scientific visualization. Color plays an enormous symbolic role in spiritual diagrams, as do specific angle relationships and geometry. Could visualizations be made more refined as tools of science if they were to use color in a symbolic or otherwise meaningful manner? Mark has done this in some of his visualizations, perhaps intuitively choosing the contrasting colors of blue and orange because they visually support each other (I haven’t yet asked how he chooses colors! Hey Mark, how do you choose your colors?) Could visualizations be translated more easily to the general public if they used familiar color or geometric relationships? Two very different questions. Quite frankly, I think it is important for high-science research to be shared with the public due to the massive investment in this field through space exploration and particle research. Science is rather new. Spiritual practices and models could represent an ancient gateway for approaching science’s questions and answers that appeals to the world’s Godly masses. Dalí did it in his 1954 oil painting Crucifixion (Corpus Hypercubus)
Lizzy's update
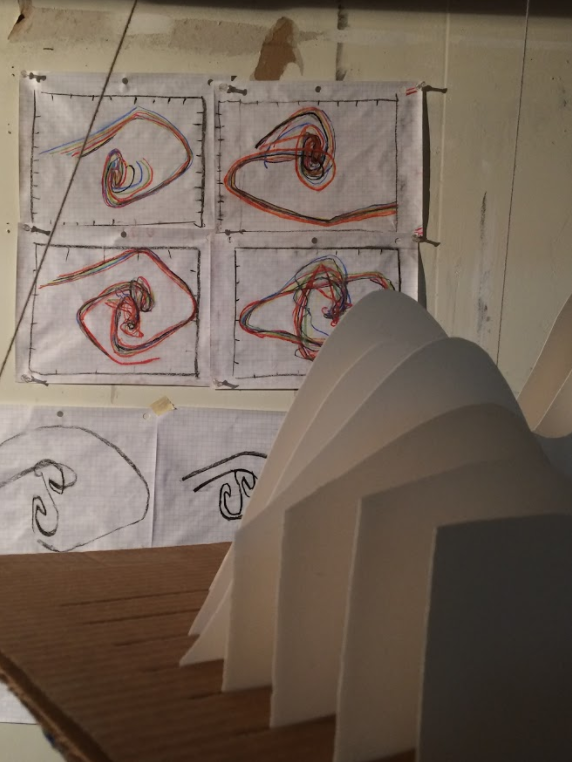
This week, I’d like to start out by sharing the sketches I made for my studio series utilizing images from Mark’s research. 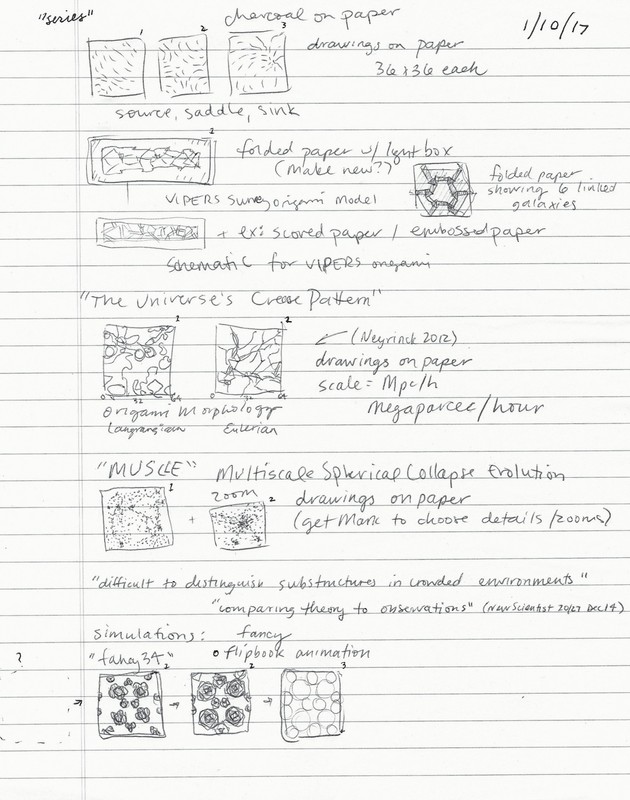
I look forward to getting started on studies for the large pieces, and working with paper for the origami inspired pieces.
In keeping with the theme of origami, we will create a piece inspired by the Local Sheet, the local cluster of galaxies including the Milky Way. Here is a folded-paper piece by Mark on display at Johns Hopkins University physics department. It was made using data from the VIPERS (VIMOS Public Extragalactic Redshift Survey) project. 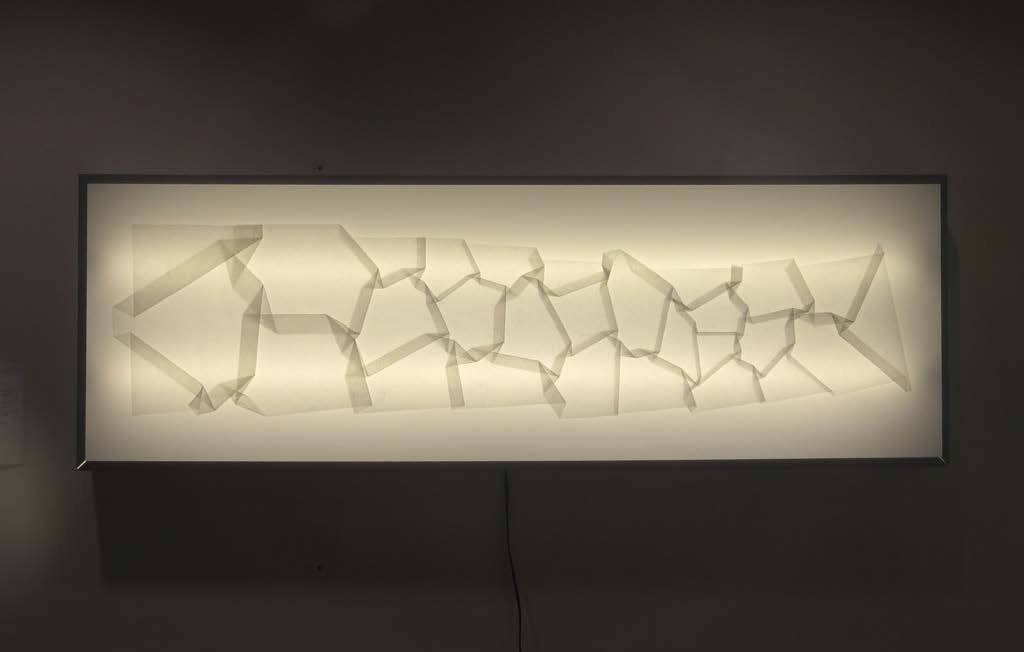
Visualizations from the survey show the distribution of galaxies of a universe about half as old as our present, which Mark and his research group translated into a schematic for origami folding after identifying major structures like nodes and filaments. I'm ready to do some research into the best papers for folding and backlighting.
Below is an incredible 3D fly through of a data plot from VIPERS in which you can clearly see the structure and how it resembles a web, net, or soap bubbles!
Some more images I will use as inspiration for studio pieces on paper, either as drawings or prints...
I think I’d like to use a method of printmaking that exposes an image onto a polymer plate using sunlight, the light of our nearest star!
Mark's update this week tells of what seems like a great meeting with some folks from the Paper Studio Northumbria. There, Prof. Chris Dorsett is interested in the intersection of images from Tantric meditation and imagery from dark matter simulations. Reading some background articles provided by Prof. Dorsett, I’m inspired to identify some patterns from Tantra to use as templates for simulations, and also in looking at the existing simulations to reveal metaphorical inspirations relating to musings from Tantric philosophy, such as spiritual depictions or conceptions of the Cosmic Web. I look forward to talking with Mark this week about their chat!
Marks update
On Friday, I visited the Paper Studio Northumbria, a space for paper working and research at Northumbria University,This sparked me to think a lot over the weekend; I wrote enough here to separate it out into sections below. I met with three fine art professors there: Fiona Crisp, Sian Bowen, and Chris Dorsett. We're planning to do some kind of presentation/"performance"/talk in the space there, maybe with some communal folding of paper, perhaps a design related to the "Council of Giants": several galaxies around and including the Milky Way and our nearest neighbor, Andromeda. For a video with some super-dramatic music about this "council", see https://www.youtube.com/watch?v=VzL7xGzfNlU. The reason for using this would be, first, that it includes the Milky Way, and second, the practical issue that it is a nearly two-dimensional arrangement of galaxies, rendered not horribly with two-dimensional paper. It should be quite interesting to give a "talk" there much different than a usual science talk, although the word "performance" is intimidating. :) Yantras They questioned some things that I don't usual think about, such as "what do the boundaries mean" in one of my origami works based on galaxy distributions? In cosmology/cosmography, the boundaries are simply the limits of what a particular galaxy survey has mapped (outside of them, the pattern is assumed to look similar). But in other cultural contexts, they can have meanings I never dreamed of. Chris Dorsett showed some yantras used in tantric meditation, for instance:
I'm sure I barely understand, but the outer boundaries there are the boundaries of the self, and the inner, fractal reflections inside are meant to represent and provoke the personal reflection that occurs in meditation.
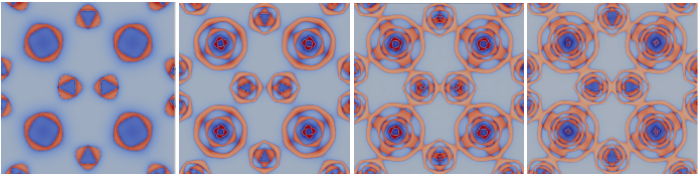
These remind me of the patterns produced in some of the simulations I recently ran (see Week 7, http://www.sciartcenter.org/group-2-mark--lizzy/mark-lizzy-week-7 for more info, and what it folds up into) 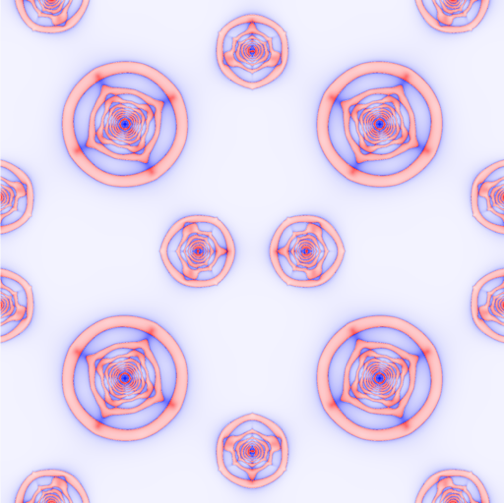
This shows a "crease pattern" for stretching and folding up a 2D arrangement of nodes -- the creases would form at the borders between pink and blue regions. Confusingly, this 2D sheet can't actually be stretched and folded up in our humble 3D, without crossing through other layers. It requires 4 dimensions to fully fold without layers crossing.
Fascinatingly, the shapes produced inside the nodes come from the influence of the other nodes around them -- they would be entirely circular in isolation. As the simulation progresses further and further, the nodes even connect to each other. There must be a nice metaphor in there somewhere! Doctor Strange?! This even made me think of the film Doctor Strange; see a mandala (I'm not sure what the difference between a mandala and a yantra is :/) There's also some 3D kaleidoscopy that happens in the film, which might end up being related to the reflections in a 3D sheet that happen in full three dimensions, e.g. It's hard to imagine a bigger cultural appropriation than in a blockbuster Hollywood superhero movie, but I thought they did actually allow an unusual amount of creativity into the film. I'm sure what they used in the film was far from culturally/religiously accurate ... still fascinating though. Finger Tutting Now, somewhere I never expected this to go: dance! I read that the hand gestures used in Doctor Strange to produce the mandalas were designed by "finger tutter" JayFunk, here seen in a commercial. This is a mesmerizing art form that uses geometric transformations of rotation, translation, and maybe reflection? This is a rare, undisputably cool application of mathematics! Mark's update
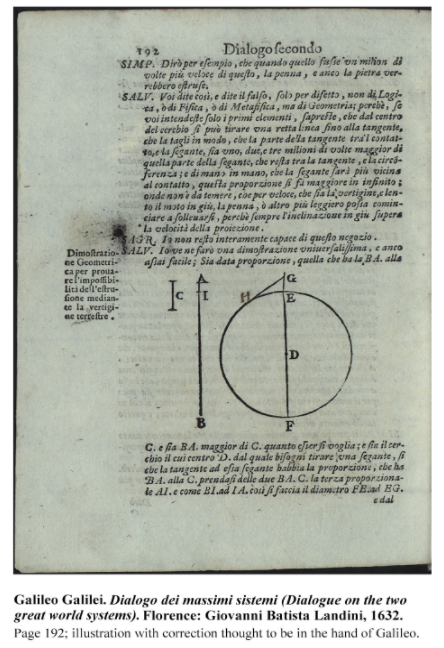
One thing I managed to do over the holidays was to modify the "cubical gears" 3D print design (see previous posts for YouTube links to that) to more accurately represent a the rotations of filaments in a 3D tetrahedral twist fold ... I don't have a decent video of the modification, unfortunately (further videos will forthcome) but as designed, three filaments turn in one direction (looking down on the central node down the barrel of each filament) and the fourth filament turns oppositely. The fantastic teaching lab group here in the Durham physics dept has been very helpful with the 3D printing. The 3D gears are a curious system: each gear links to its neighbor(s), causing them to turn oppositely. Gears turning in the same direction can be achieved by putting a gear in between. The gears turn about points on a sphere, like in this spherical Voronoi tessellation. And the gears can be thought of as nodes on a graph. In fact, for the gears to turn successfully, this graph must be "bipartite", meaning it can be colored with only two colors, without bordering gears being colored the same way. The two sets of nodes being those turning clockwise when looking down from the outside, and those turning counter-clockwise. The famous "four color theorem" refers to a similar property, of arbitrary regions of a 2D map: it's always possibly to color them with 4 colors, which took a very long time and a computer to prove. Coincidentally, streams of dark matter in the universe (contiguous regions of the primordial universe that are bordered by caustics or folds) also form a bipartite graph: those An arbitrary 3D set of solids has no limit to the number of colors required to color it, but this bipartiteness property greatly restricts the arrangement of streams in this case, reducing the coloring number from infinity to two. That's all for now. but this Friday I'll be visiting the Northumbria Paper Studio in Newcastle, England, Hopefully we'll collaborate with them somehow! Lizzy's update Since our last update, I have been completing applications to M.F.A. graduate programs. The process of writing is usually very clarifying for me in my practice and is something I look forward to during my graduate studies. I should be notified on my status in spring! For my applications, I took a hard look at my undergraduate studies. Here’s a snippet of rough draft that didn’t made it into any statement: After one tumultuous year of attempting to adjust to RISD (Rhode Island School of Design) and everything it had to offer, I was reminded why I wanted to enter the art world in the first place, my favorite artist, M. C. Escher. What seemed like a childish fantasy as a brainy youngster in middle school soon gave way to more serious pursuits of charcoal figure studies and technical skill. As I filled my mind with more and more background education for the arts, Escher was almost buried. Was he even mentioned in the art history lectures? Without very much emphasis on STEM subjects in preparation for art school, I had lost sight Escher in my rear view window. My tenacity for STEM subjects held on, despite my neglect, and I coordinated to unofficially audit a Brown/RISD Dual course that did not fit completely into my schedule. Titled “Making Visual Illusions” the class introduced the neural basis of the human visual system, historical examples of optical illusions, and detailed the reasons why these illusions exist in the brain. It turns out the class itself was part of collaborative research on the part of the two professors, who are actively researching art and science collaboration. Their findings were published in June 2016 in the interdisciplinary journal Leonardo. (A link to download the article is here, although it requires subscription to the journal or purchase) The professors names are Leslie Welch of Brown University and Carl Fasano of Rhode Island School of Design. It was not until early 2016 that I even knew the class was a research project, but I am not surprised at all to find out. This unique study flavors so much of the work I hope to accomplish. Not only does it exist at the intersection of art and science, or specifically combine the practices of the scientist in their lab with the practices of the artist in their studio, it also contains an educational component: how can sci-art education in the classroom be improved? It is an immense privilege to work in this field. In talking with my sister, postdoctoral researcher in astrophysics at the University of Amsterdam, over the holiday break, we mused on the amazing quality of being able to do such specialized work, a direct result of what is clearly a thriving global culture in this sector. Out of respect of that system, and for the folks who may never get as close to it as we, my applications to grad school made clear my goals: As a working artist, I hope to do collaborative, project-based work across disciplines, with an emphasis on the poetic communication of science research and the promotion of STEM appreciation and awareness. I am interested in exploring some ideas exposed in my applications in my collaboration with Mark. Within the field of printmaking, my intended concentration, I am interested in the relationship between its role in disseminating scientific knowledge during and after the Scientific Revolution, both through text and figures, and the role of the draftsman. What kinds of relationships were there, in other words, in what capacities did the creators (writers, typesetters, draftsmen, and engravers) of a published volume collaborate? How do these historical issues relate to the current rapidly and widely available knowledge centers of our time? To what limits does that availability stretch? And, what role can, or does, the contemporary artist play in aiding the scientist in varying levels of communicating their work? What can be said of Mark’s inspiration taken from physicist and origami artist Robert Lang, or his and his colleagues’ use of graphics in presentations, publications, and outreach? Is it important work that makes it to the public stage, or just interesting work? Happy New Year! Mark's update Some good news, for science and art in general, and for Lizzy and me: a Franco-German TV documentary made in 2015 called "The Origami Code" that featured me is going to be a NOVA episode, (tentatively?) scheduled for February 15, 2017! I've been working a bit with the producer to try to clarify the 5-minute or so section about origami and cosmology, and I think it's helped. I also made the following video, for possible inclusion in the program. I think it won't end up in the show, but it does show how a galaxy with three filaments coming off of it would be folded out of a sheet. First, the inner parts of it assemble, and then the outer parts. (This video intends to show the geometry and folds of a single snapshot, and does not show a time sequence of what first assembles). The grey/black borders between orange and blue regions are creases in the final, folded-up sheet. These creases become invisible at the end, since they're only at the edges). Happy New Year!
Lizzy's update
As Mark mentioned in his update this week, the tetrahedral collapse model is still in the works. In case you don’t recall what the model is supposed to demonstrate, here is a diagram of large-scale structure in the universe that labels some of the parts. The unit shows is a megaparsec, to give you an idea of scale, single parsecs are used for measurements within the Milky Way, whereas megaparsecs measure objects and structures much larger. 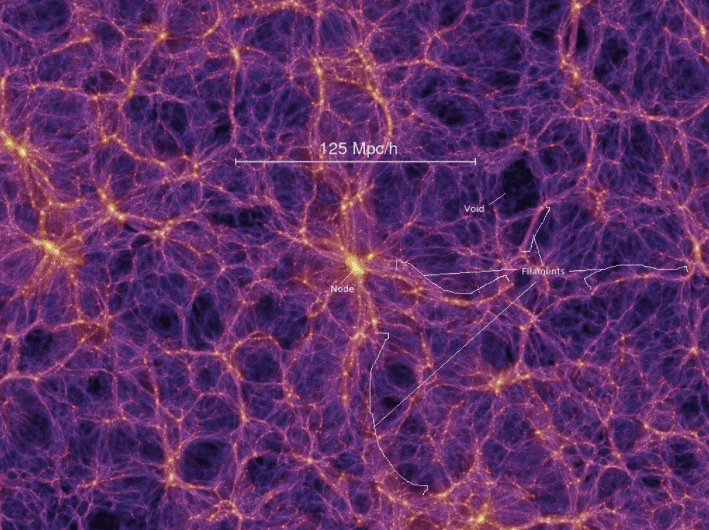
Here is a little sketch I made for my own understanding of what we’re trying to create:
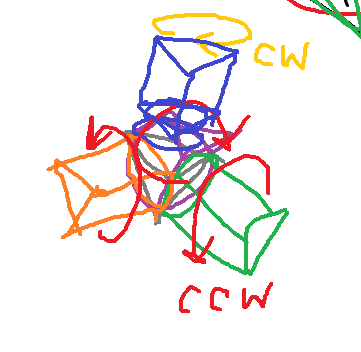
The filaments are modeled by triangular prisms shown in blue, green, orange, and purple, the node would be in gray (if it wasn’t so obscured). The idea is that the central tetrahedron collapses in on itself and inverts, demonstrating a 3D twist fold. This requires that one or more of the filaments spins in an opposite direction than the others. The idea behind the 3D twist fold is essentially that it “generates structure” The model is of practical use in identifying and accurately measuring galaxies as well as mapping the Cosmic Web and arriving closer to an accurate model of the early Universe.
But all practicalities aside, the impact of advanced physics research often seems lost on the public. Perhaps an outstretched hand is all that is needed to invite the public into this world. Sometimes all it takes is an easily digestible model, maybe one that is scientifically impractical, for the public to get up to speed with current research. The effects of the work may never directly impact their lives, in other words, it won’t put food on the table, but their worldview can be richer for them knowing just what their fellow humans are working on. It takes a mutual understanding for disparate parties to communicate, a common language, a common goal. Art is one of a few universal languages, and truly offers one of the best bridges between the worlds of high science and layman. A work of art can to speak to a viewer in a hundred languages, some of which they may be fluent in, others which their peers and neighbors may know. In that way, a work of art can be a Rosetta Stone for different walks of life to use to understand each other, for science to connect with the world at large. Until next time, happy holidays all! I know I'm looking forward to the return of longer days.
Mark's update
I did succeed in 3D-printing some 3D gears in the department where I work at Durham University (like the video below). It is very cool, and clarified to me how the gears work. But the actual gears we would use will have to be modified, unfortunately. In the model as in the video, turning one of the large corners of the cube moves the other large corners in the same direction (looking down at each corner). In the "tetrahedral collapse" model that describes the formation of a galaxy, though, the filaments coming off of a forming galaxy cannot all be going the same direction; there's a curiously simple yet obscure law that they obey: the sum of the cotangents of the 4 rotation angles of filaments around a galaxy equals zero. It occurred to me that a rather simple modification of the model in the video would represent tetrahedral collapse better. This change would involve removing 3 of the 4 small gears, so that one of the large gears is in direct contact with the other 3 large gears -- that way, 3 of the large gears would rotate the same direction as seen looking down onto the cube, and the 4th would rotate in the opposite way. This would only require modifying one of the parts (not really worth explaining in detail, since even I wasn't really sure how the thing, designed by someone else, worked until I manipulated it personally), which I hope to do while I'm in the US for the holidays ... Hopefully, in investigating this design, I can gain some insight into the scientific model, as well. Happy holidays, everyone!
Lizzy's update
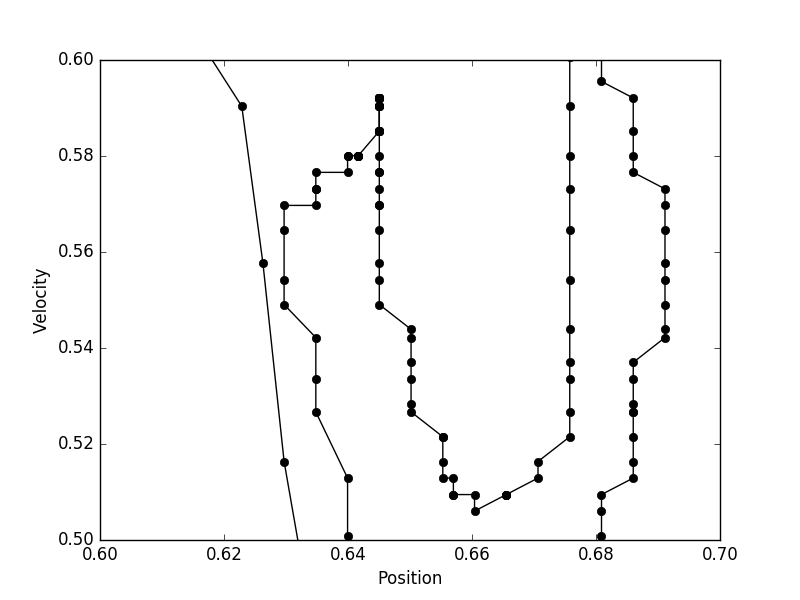
This past week I started work on one of the many project mentioned earlier. Here are some images from my studio of the sketches I did of position-velocity phase space plots from one of Mark’s simulations. Also shown is a 3D model of a graph in three dimensions.
Studio view showing charcoal and pastel drawings, as well as 3D cut paper model
I tried to keep things loose and gestural with the drawings. I love the effect of transparency of charcoal on paper, and used some of that in the black and white drawings to show where data points appeared bunched up or spread out on the plot.
I was also able to download the open source and free visualization software, ParaView. Here are my first screenshots from simulation data previously shared in motion form, from Mark’s update on November 1.
Mark's update
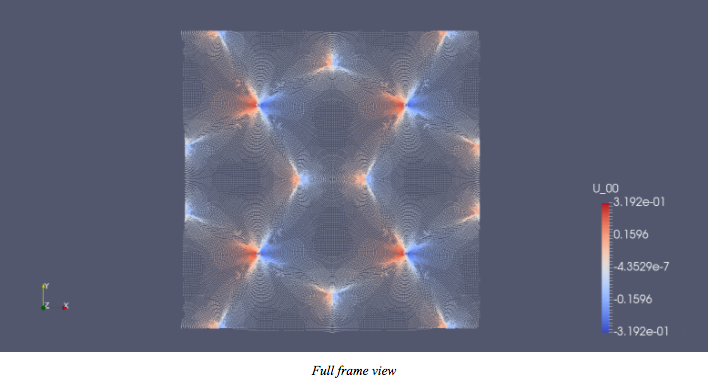
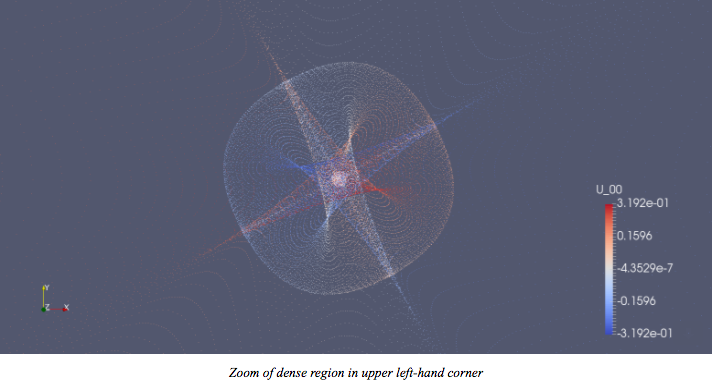
I have been looking into producing gears that spin essentially like filaments would in my tetrahedral collapse model. One goal Lizzy and I have is to connect these gear units along a network, to illustrate some constraints and relationships that would happen if galaxies in the Universe were linked this way. A bit of searching on 3D printing design sites led me to a class of gears that can be 3D printed, and seem to be useful for this task. Most (if not all?) of them are fundamentally based on a tetrahedron, even the first one, the cube: In fact a tetrahedron is at the center of that. Why? Consider the familiar cube (more familiar than a tetrahedron for most of us). It has 6 faces, and 8 corners. The shape formed by replacing all corners with faces is the octahedron. But replacing only half of the 8 faces (some set of 4 that are not adjacent) produces a tetrahedron (the basis for the tetrahedral collapse model, the simplest way to form a collapsed object out of a non-stretchy material in 3D). There are several other cool models based on the same object: a heart and a skull! If you watch these and think about these, they are based on tetrahedral geometries! Since the tetrahedron is the simplest solid, imagine all the possibilities for more complicated networks of gears... Lizzy's update Mark and I spoke recently about what we would like to “do” now that we are past the halfway point in our formal residency collaboration. We revisited the tetrahedral collapse toy model. I think it would be interesting to share this concept with a mechanical engineer, someone with knowledge of design and system dynamics. Not only would it be a great project to present once finished, it is helping me understand the concept more clearly, and Mark mentioned he has a desire to hold the model in his hands to help him work out his own thoughts. We’re both interested in creating some objects that could play a role in demonstrating or illustrating concepts, like the different parts of the structure of the dark matter sheet: walls, filaments, nodes, and voids. I have a number of series inspired by our collaboration that would be wonderful to share in conjunction with some of Mark’s visualizations and writings in the form of an exhibition. The series include traditional pastel and charcoal drawings from data plots in 2D, the “Phase Portraits”, fine paper models of origami folding patterns, and an idea still in its early phases, a print series using the beautiful, simplified, geometric simulation visualizations. I’m also thinking about different forms of traditional animation as well as representing the progression of time in a static way, like a progression of frames shown side by side or stacked in some way. I am formulating some game plans for those art projects with time frames and budgets. I feel that our collaboration is happening very naturally. We’ve been sharing our progress as it happens, bouncing ideas off of each other, some of them better than others, and it seems like we really have a lot to work with within a wide range Although it will not be until later this week that we get together via video chat to work on some visualizations, I am planning on getting into my art studio and documenting sketches that I’ve made and working on a few more to share next week. An interesting conceptual crossover: the grid method as a drawing tool. You take an image that you want to copy and you overlay a grid on it, then recreate the same grid onto your blank canvas, and copy square by square. You’re basically creating a little coordinate system. I don’t have a projector at my current studio, so I’ll be using this method to transfer some of the plot images from Mark’s research! Remnants of the grid transfer system may even find their way into the final pieces... Mark's update I have been working on some visualizations to clarify the idea of the "dark matter sheet" ... a curious object in cosmology is a circular, "perfectly compensated void" -- a density depression in which some matter is scooped out from the middle and placed entirely along a circular ridge around it. The first movie shows how the density evolves in time in a computer simulation -- matter evacuates in the middle and piles up along the edge, and then pushes into the region around it (the behavior at the end here is not widely appreciated in cosmology, by the way). The second movie shows explicitly what is going on in "position-velocity phase space" -- plotting each matter parcel in a space including both its usual position, and its velocity (one velocity coordinate for each position coordinate). In this case, we have a simulation with 2 position coordinates, and formally 2 velocity coordinates, but it was set up in a particularly symmetric way so that all of the velocity is radial. This makes it much easier (i.e. possible at all) to plot all the information in only 3 dimensions. You can probably see how the white area in the middle expands (growing thinner -- thus the evacuation, when you project this down to the x-y plane), and the edge moves out, rolling up the rest of the material like a carpet. All the regions here are colored the same way throughout the video, so you can see where stuff is transported.
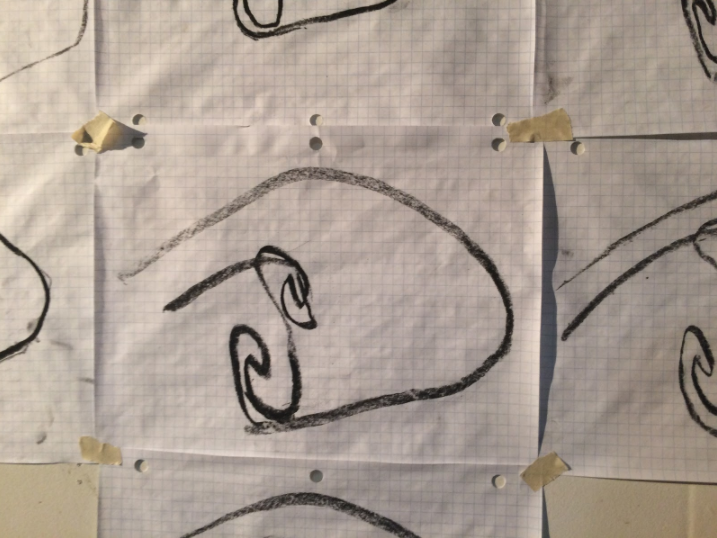
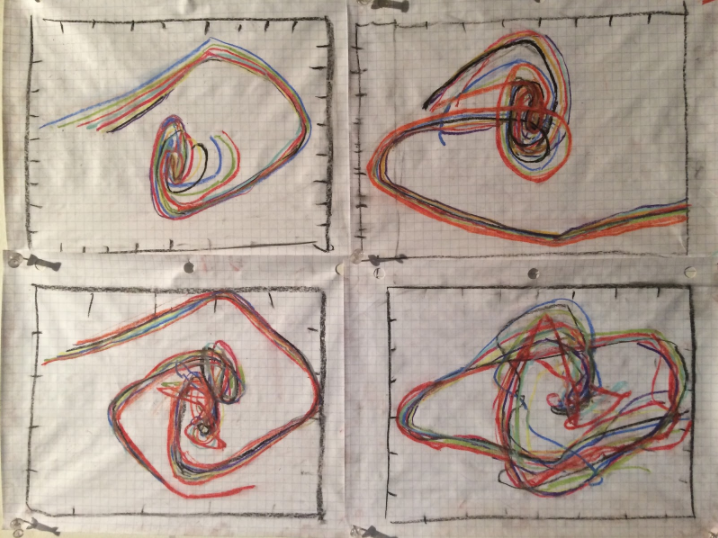
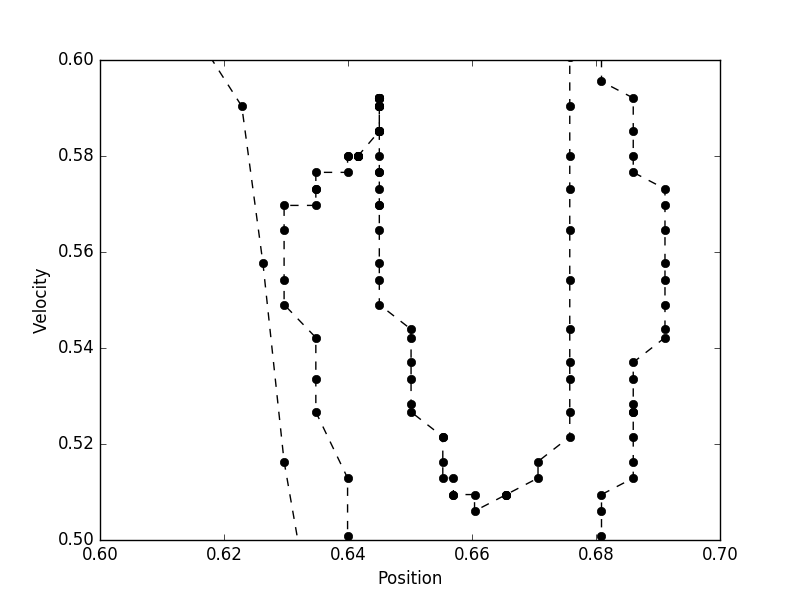
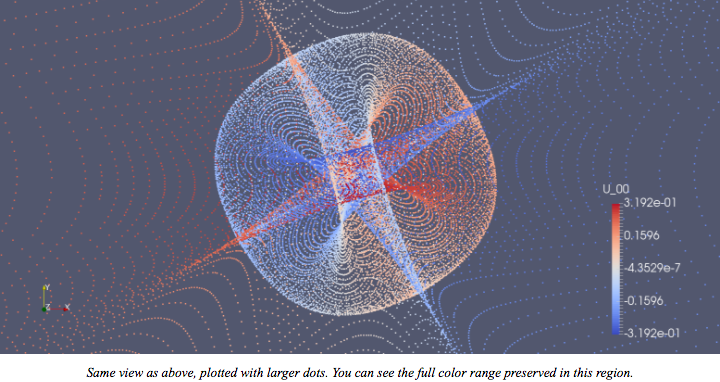
Besides these videos, Lizzy and I are working on some ideas to represent these kinds of thing with paper, and maybe even gadgets representing and capturing the essence of how rotations of galaxies and filaments between them might occur in the cosmic web. Stay tuned! Mark's update Last week, I visited Oslo. Unsurprisingly, given the long nights they have this time of year along the 60th parallel, they have lots of interesting lights! Here is one that I saw in the airport, that reminded me of a void in the cosmic web; its "walls" would correspond to the sheets of paper, its "filaments" would correspond to the seams, and its nodes, or galaxies, would correspond to where seams come together. 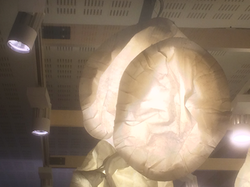 I didn't have much other time for art pondering this week, but it seems increasingly likely that Lizzy and I will explore some of the geometry of galaxies in "phase space" ... A galaxy in even a relatively simple two-dimensional universe forms by folding up a 2D sheet in 4 dimensions, impossible to visualize directly. As a stab at visualizing that, below is a video I made a few months ago. It's an alternative view of this following 4-fold-symmetric simulation, made by Thierry Sousbie, the author of the fabulous gravitational code ColDICE that I'm using. Here, the color shows the density at each point in the two-dimensional square: deep blue has very little material, and red has a lot of material bunched together. 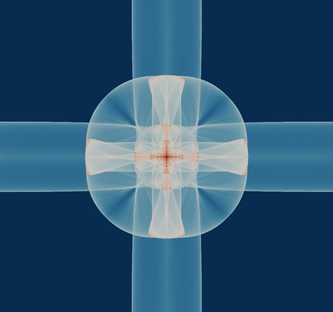 My movie has the same structure, except pulled apart and tilted a bit ... Thierry's is a projection through the "z-axis" (almost directly out of the screen, but tilted a bit to reveal the structure). This z-coordinate gives the initial distance to the center of the blob. It changes with time as the structure stacks up. The red/white/blue colors are an attempt to track where different parts of the initial sheet end up; the color in different patches remains the same throughout the movie. One thing that does help me to understand the structure is that the bulb at the tip oscillates back and forth but stays the same size ... that means that the part of the galaxy that first formed stays relatively intact, but just oscillates in and out sort of like a pendulum. Lizzy's update Mark and I were very busy this past week with different activities, but we’ve made individual progress on some things. As Mark completes visualizations for his research, he shares them with me, such as the captivating video he is sharing this week! I downloaded the visualization software ParaView, and have yet to successfully complete any graphing with it. Instead, my partner Craig created a very simple Python script for me which I used to plot some of the same data I shared last week. To illustrate the the simple power of graphing as a tool of observation and insight, I plotted the data using different styles such as a line, dots, and dots and lines, as well as at different value ranges. The data itself is already a zoomed-in section of a position-velocity phase portrait, and I’ve further zoomed in on what looks like a complex area. “Look, you found an ear.” said my partner when I plotted the first zoomed in section. 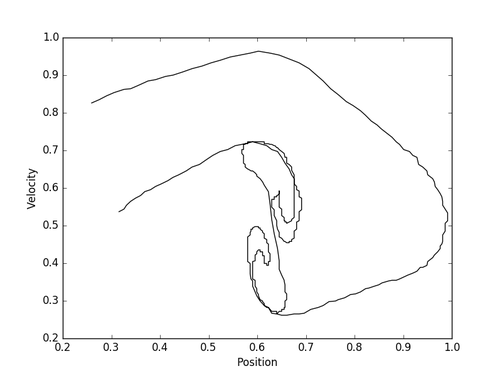 Line Plot 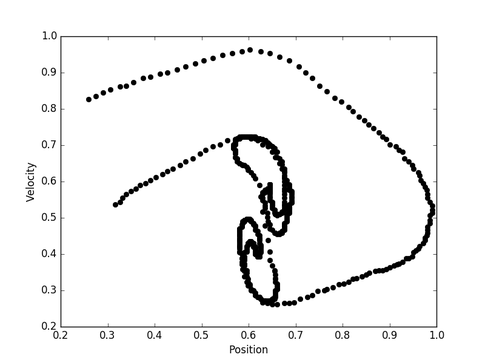 Dot Plot 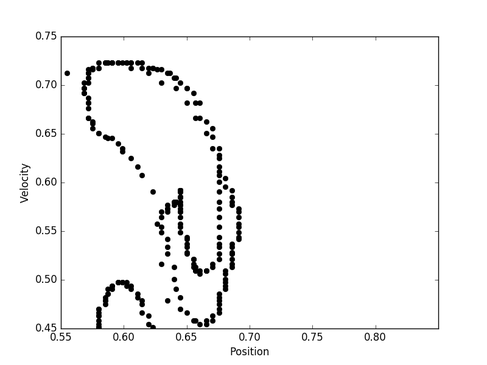 Dot Plot showing the 'ear'
Dotted line, dot plot (left) and Lined dot plot (right) I found the dots to be more illustrative of what is being plotted: a particle in a simulated dark matter sheet. The dots show where the data points “stretch” and “bunch”. Velocity and position are both functions of time, but there are no values for time in this graph. Time is suggested by the data points being numbered from 1 - however many there are, point 3 comes after point 2 comes after point 1… suggests the progression of time. What I noticed from the dot graph is that at high velocities the particle’s position varies by a great degree in certain sections, and when the particle is “slowing down”, going from a higher to a lower velocity, its position changes very little. In the furthest-zoomed-in graphs, the last two, you can see where there are points that create a vertical line, showing no change in position even when velocity is increasing, or decreasing. The vertical line shows up in a few places, as does the occasional two-data-point horizontal line, suggesting no change in velocity even though where was a position change. Here I am, an artist, making the simplest of insights into a plot, and I feel like a real scientist! All of these insights could change or be explained away by different visualization techniques, for example a more refined collection of data points might make vertical or horizontal lines disappear as data points fill in the empty space shown in these graphs. Perhaps “noise” in the data is being smoothed out, something I noticed SciArt collaborators David and Christina mentioned last week. I will have more on these plots next week after I meet with Mark about them! I hope I've done this explanation justice...
Speaking of other SciArt collaborators, I noticed a few lovely synchronicities amongst our updates. We must be reading each others work… David and Christina, working with the sonification of data into musical compositions along with choreography, mentioned their initial exclusion of silence, or musical rests, in the compositions, and how that may be added in a meaningful way. Also mentioned was the perspective on “rest” in dance, analogous to silence in music. I find that “silence” in visual art is vital, for example, empty space, “white space” in graphic design, and blurred details or imprecision are all elements of silence and rest in art. Brittany and Cara, working a little bit with the secret life of insects, mention insects’ silent role in decomposition, “What is required for us to not take silence for granted?” they say. These updates were from the same week! Hey, are you all cross-group collaborating?! Ben, partnered with Paz, updated last week on the prevalence of the use of data visualization in our collaborations, and the nature of “open access” data, which seems to be not-so-open after all. From what I read, there is a sense of “can I trust this open source data?” in regards to environmental data that, again, seems to be open access. Ben says, “I see why it’s called “invisible data” and I continue to wish for more democratic ways to share scientific research.” From this, I was reminded of one of my first conversations with Mark, in which I asked him whether or not there were any aspects to his research that we should not share with the public, if we would be stepping on any proverbial toes by doing so, or if there were any copyright issues to consider. He assured me that for as far back as he could tell, astronomy research has always been very open, and it seems to be remaining that way. This was one way I acted to establish an atmosphere of trust between us. Joana, partnered with Pooneh, updated last week on her own interface as an artist utilizing institutions for their labs, and how she upholds a standard of gaining the trust of those with whom she works before engaging in a request for collaboration. Maintaining that trust is also central to her success in cross-disciplinary work. We’re taking a holiday break this week, but will keep communication lines open between us, just no blog! In that time, Mark and I will make a game plan moving towards the end of the residency and will share that in our next update. |
Visit our other residency group's blogs HERE

Lizzy Storm is an artist and owner of Lizzy Storm Designs based in Atlanta, Georgia.

Mark Neyrinck is an award-winning astrophysicist and cosmologist, and a postdoctoral researcher at Durham University, United Kingdom.
|