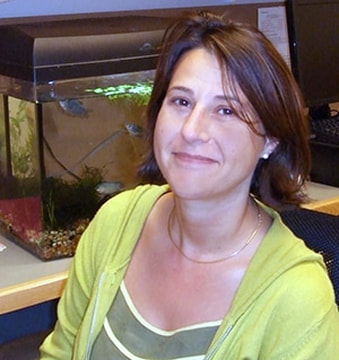
AC: What does your day look like as a visual designer at Harvard Medical School?
CL: I create visual content relating to a diverse list of research projects. On a day to day basis, my job can be fairly eclectic. My responsibilities range from creating graphs and illustrations to explain or strengthen an argument in a scientific report to designing online user interfaces for visualizing or analyzing an array of scientific data. I am also in charge of the design, innovation and operation of multiple websites within my laboratory or in collaboration with other groups, such as the Immunological Genome Project (ImmGen.org).
Overall, my role is to help scientists present their findings and theories in a simple yet precise manner, guide the audience and let the data speak in the most comprehensible way. Within a number of established rules and protocols, I work with researchers to select the best visual representation, color or layout. I regularly hear jokes about my obsession with color-coding… People rely on me to help manage graphic communications they may not be familiar with. In the process I too often have to learn new tools or techniques. A couple of months ago, I had to brush up on video editing skills to create a step-by-step protocol video which was published in a scientific report for the journal Cell.
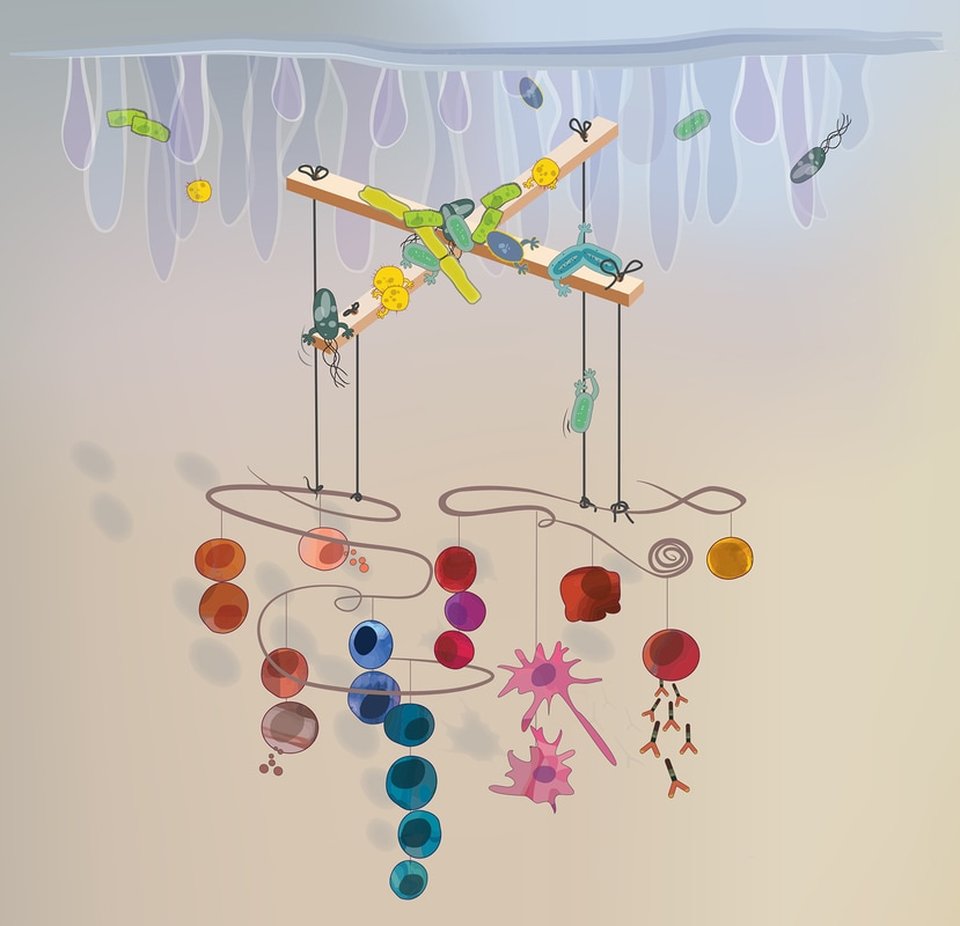
Another aspect my work is more “creative” in nature. I design numerous images, icons, themes or graphical abstracts used in various forms of science communications. Although probably not deemed the most crucial in the context of my workplace (sadly), my favorite thing is the occasional illustration for the cover of a scientific journal. This provides an opportunity to really combine “Art and Science” with a more personal touch. Pastime and work time become intertwined. Earlier this year, I drew inspiration from one on my previous 3D artwork to create an illustration depicting how microbes in the gut may have an influence on the immune system.
AC: You work in a variety of media, including digital collages and painting. How do you decide which medium is best to represent an idea or portray a concept?
CL: When it comes to artwork directly related to my work, almost everything is digital, partly because of the nature of the data and material I start with and of course so it can be shared easily via online communications.
I do however enjoy exploring various media in my free time: painting, drawing or creating 3D objects such as mobiles. In my free time I don’t want to be constrained by rules or conventions and I simply favor any (reasonable) spontaneous idea and follow where it leads me. As an example, after a visit to an Asian art exhibit, I became interested in ink-drawing and Japanese themes. This translated a few weeks later into my own interpretation of a whimsical Japanese dragon portrait using colored ink and metallic markers on a plexiglass board. While I am clearly very far from a traditional drawing, Japanese or not, I actually had a lot of fun just experimenting with unusual tools and a totally new style for me.
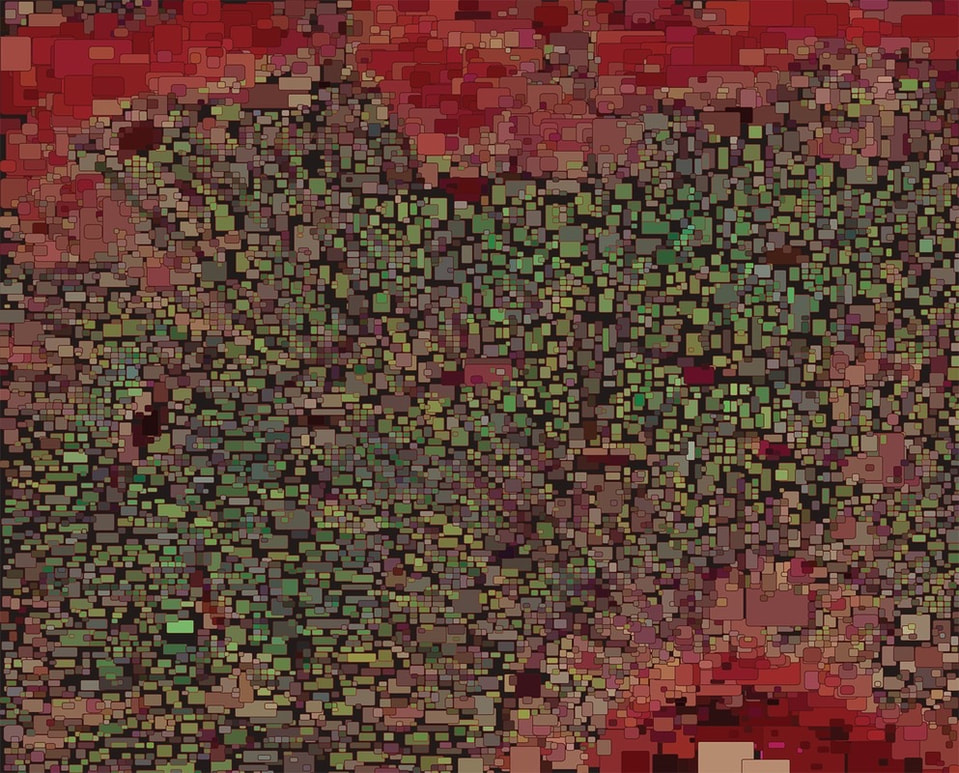
Regardless of the medium I choose, I find myself constantly dissecting architectures and colors, looking at the patterns of a leaf, textures of various surfaces surrounding me. I build a mental library of patterns and shapes, memories of impressions that perhaps I will use someday in a graphic representation. I often use patterns made of smalls colorful shapes symbolizing, in my view, intense activity, like buzzing insects in a beehive. I actually included this image in one of my digital rendering of a cell, where the nucleus, the center of activity, is represented as a bubbling mix of colors.
AC: Tell us about the Immunological Genome Project and your role.
CL: The Immunological Genome Project (ImmGen) is a collaborative scientific research project that is currently building a gene-expression database for all characterized immune cells in the mouse. I joined this project at its beginning stage and have been in charge of developing the ImmGen website and all related graphics and illustrations.
Aside from gathering and analyzing data, one of the big components of the ImmGen project is providing data visualization tools, available to the public through online interactive interfaces. In the context of ImmGen, we call them data-browsers.
Most data-browsers consist in various collections of curated data that can be examined through distinct angles (focusing on a cell type, a particular gene, comparing different groups…). Some are also designed as exploratory interfaces where scientist can upload and analyze their own data.
I am also part of the team designing ImmGen data-browsers, focusing, of course, on the visual aspects in collaboration with developers and researchers.
AC: What are you currently working on? Where we can we see any of your work?
CL: Most of my artwork can be found on my site: http://Catherinelaplace.com/ or my online portfolio: http://catlaplace.portfoliobox.io/
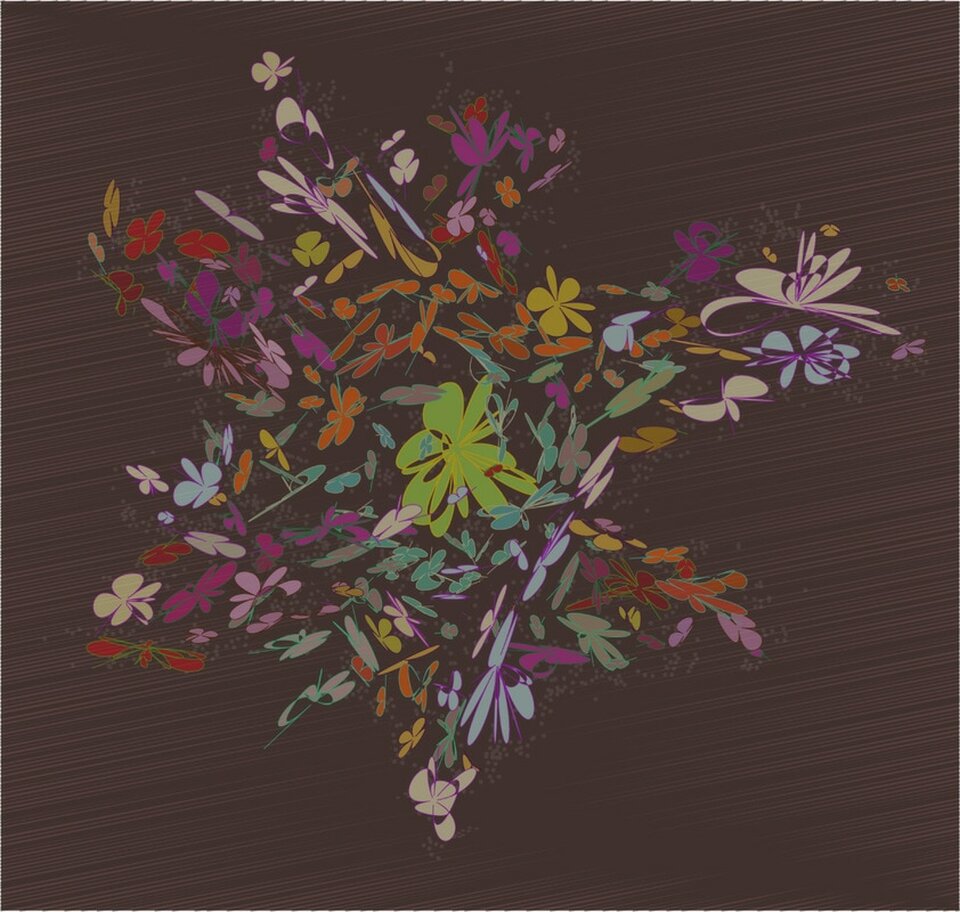
One ongoing project is creating a collection of digital images for what I call a “Cell portraits Gallery”. (http://catherinelaplace.com/Gallery.html). My goal is to create digital caricatures based on the most prominent characteristics of each cell type.
One of my recent illustrations can be found on the June cover of the Journal of Molecular Biology
(www.sciencedirect.com/science/journal/00222836/429/11)
Finally, some of my artwork can be found in a collection of scarves, tops or pillows: https://shopvida.com/collections/catherine-laplace

